Spatial Market Analysis with WebGIS
How to Successfully Perform 6 Different Analyses on Interactive Maps with WIGeoWeb
Anyone who does business, must know their market. WIGeoWeb informs you about market shares, target groups, competition and market penetration. The big advantage over other market analysis tools: The data can be viewed at any spatial level. Analyze markets globally, in a single country, region or zip code.
When is a market analysis spatial, and why does it matter?
A spatial market analysis is the systematic examination of target groups, competitors, and market potential always with a focus on locations and regions. It helps answer key questions that drive business success:
- Where are your most attractive target groups?
- Where do you generate the highest revenues?
- Which regions hold untapped potential?
- Where is your competition ahead?
By answering these questions, you give your company a clear knowledge advantage and create the foundation for better decisions in sales, marketing, and expansion.

Why Spatial Analytics Makes the Difference
If you want to truly understand your market, you need to ask the right question: Where? The spatial component reveals where your opportunities lie and how to achieve your goals most effectively.
With a modern spatial market analysis tool like WIGeoWeb, you can identify regional potentials and risks at a glance - interactive, clear, and directly in your browser.
Lead your company to success with clear, data-driven market analyses.
6 Types of Spatial Analysis and Practical Tips for successful Market Analysis
Discover how spatial analysis can make your market transparent and discover the advantages of geomarketing. Our market analysis software uses data to provide valuable insights for better business decisions.
How WIGeoWeb supports Spatial Analytics
WIGeoWeb links your company, market, and geodata on interactive maps. This creates transparency and enables new insights:
- Combine and visualize all relevant data in a clear manner
- Analyze market potential, sales, or locations on a regional basis
- Locate target groups and competitors at a glance
- Easily create up-to-date reports for operational measures
Thanks to flexible interfaces, intelligent rights management, and optional cloud or on-premise solutions, WIGeoWeb can be optimally adapted to your requirements. It is intuitive to use—ideal for a wide variety of departments.
Exploit the full potential of your market: With the market analysis software WIGeoWeb, you can take your analysis and decision-making processes to the next level – location-based, efficient, and future-proof.
... the Market Analysis Tool WIGeoWeb
Maximum Flexibility for Your Business: With WIGeoWeb, marketing, sales, and business development teams can analyze data at any spatial level - from EMEA down to the smallest district.
All departments work with one tool that scales individually and provides a clear overview of your markets at any time.
Identify market opportunities and customer potential at a glance.
Six Comprehensive Market Analyses in One Powerful Software
WHERE? - From customer analysis to market potential, everything at a glance
We will now show you 6 of the most common analyses as part of a comprehensive market analysis. They are all good for viewing spatial data and can be done with WIGeoWeb. Once you have carried out these 6 analyses, you will have a very holistic understanding of your market that will form the basis for you to make informed decisions for your company. The order is not fixed and depends on your current needs. The questions behind the analyses however, are very familiar to everyone in business.
Tip!
Follow a carefully thought out and structured approach. It may sound obvious, but it is often neglected. Only those who know the goal can achieve it.– What do I want to know? How exactly do I need to know?
Do not underestimate the effort required for a market analysis and use your resources wisely. Formulate your questions carefully as they are crucial for the rest of the process such as the selection of the type of analysis, methods, tools and data that you will use.
1. Customer Analysis in WebGIS
With customer analyses, you are dealing with the data of your existing customers, i.e. company data from your management systems. It is about gaining clarity on “good” and “bad” customers and gaining knowledge about customer satisfaction. Measures can be derived from this for both customer retention and new customer acquisition.
Good customers are profitable and they are loyal. Customer loyalty is important because winning a new customer is five times more expensive than keeping an existing one.
Sales are included in the determination of the customer value, but also the costs for customer service. An ABC analysis is suitable for determining the customer value: According to the Pareto rule, the top 20% of the customers generate 80% of the sales.
Questions Answered by a Customer Analysis
- Where are my customers?
- Where are the good and where are the bad customers?
- Which customer groups do I have, and how are they distributed regionally?
- How are my A customers given optimal service? Where can I optimally use my resources for customer service?
- Which B customers can I turn into A customers?
- Are there any changes in my sales / regional structure?
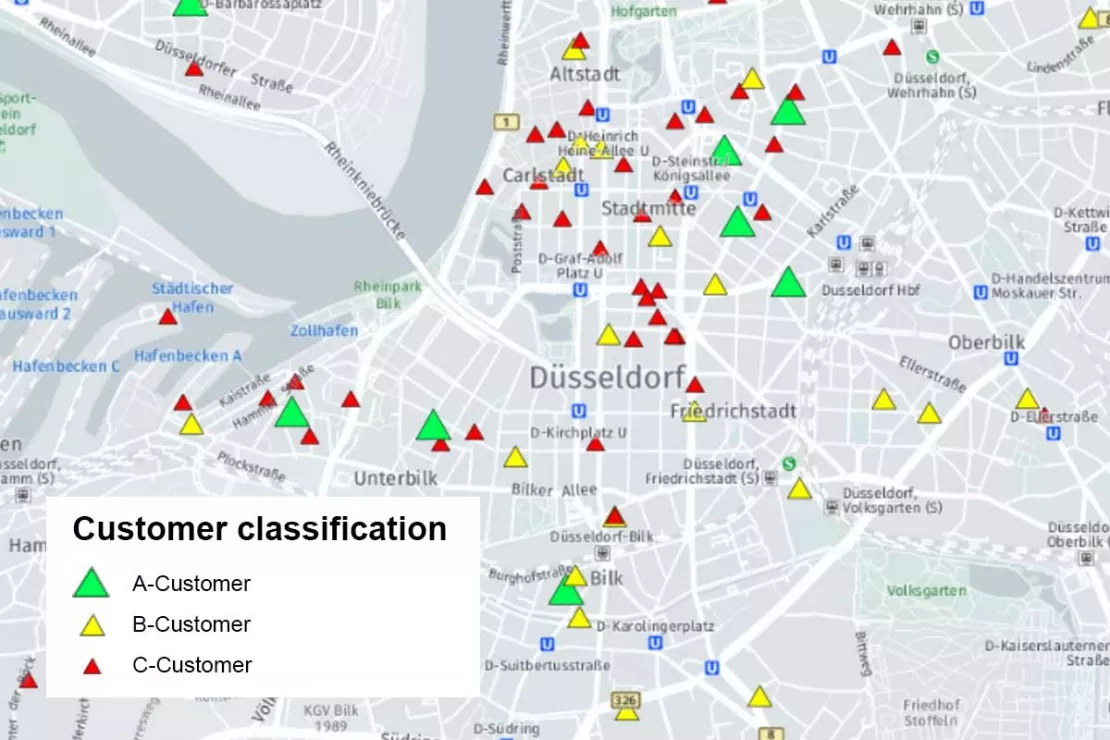
The spatial distribution plays a major role in this type of market analysis, because it has an impact on your sales and marketing. Regardless of whether you have a sales force, operate branches or work with a dealer network, you can gain a lot of knowledge from the spatial distribution of your customers that will allow you to better manage your company.
The customer dataset includes a coordinate, making it ideal for geographic visualization. We often experience when someone sees their own CRM data on the map for the first time: “Oh, now I understand!” Because company data is often extensive and therefore difficult to read. What was previously hidden, can now be seen at a glance.
See where your customers really are.
2. Target Group Analysis
Even before you have built up a customer base, you will probably deal with your target groups. You know your product. But do you also know who buys it? Here we mostly speak of end customers and characteristics. The most important characteristics are age, purchasing power, sometimes gender and, as basic it as it may seem, the number of inhabitants (where do a lot of people live?). There is data on hundreds of characteristics, so you can also search for singles, garden owners, apartment buildings, high car density and purchasing power for certain product lines, or you can combine two or more characteristics.
Even if you have been in business for a long time, you will be concerned with target groups again and again. Very often it is about developing measures for marketing and advertising, but it is also important for sales planning to know where the target group can be found. When you make decisions and changes, they can be easily justified by the results of the analyses.
Questions Answered by a Target Group Analysis
- Where can I find my potential customers/buyers?
- Where can I find a high number of women aged 45-64 with a high purchasing power?
- Where is the purchasing power for consumer electronics particularly high?
- I know where my sales are good. Why am I selling well there, what are the common characteristics of these customers?

Characteristics also always have a spatial reference, a distribution that can be represented geographically. WebGIS shows you geographically, for example, the distribution of male residents in Germany as well as their purchasing power. Again, you can perform a large-scale or small-scale analysis at the ZIP code or grid level based on your specific needs. You can place the two characteristics on top of each other and form an intersection (overlay analysis). The result can be exported as a table and further processed (e.g. by your advertising agency, which controls your campaigns), but the numbers can be interpreted much more easily by looking at the map.
This type of market analyses saves some companies expensive market research, which could be purchased externally or done internally, but both are time-consuming. The company’s own data is usually not sufficient for target group analyses, so you will need demographics. These are available in high quality for both the German and Austrian markets (and internationally if required).
Questions Answered by Determining the Market Shares
- What is my absolute market share (= based on the total market volume)?
- What is my relative market share (= based on the largest competitor)?
- How are my sales distributed? Where am I doing well? Where am I doing poorly? What can I conclude from this?
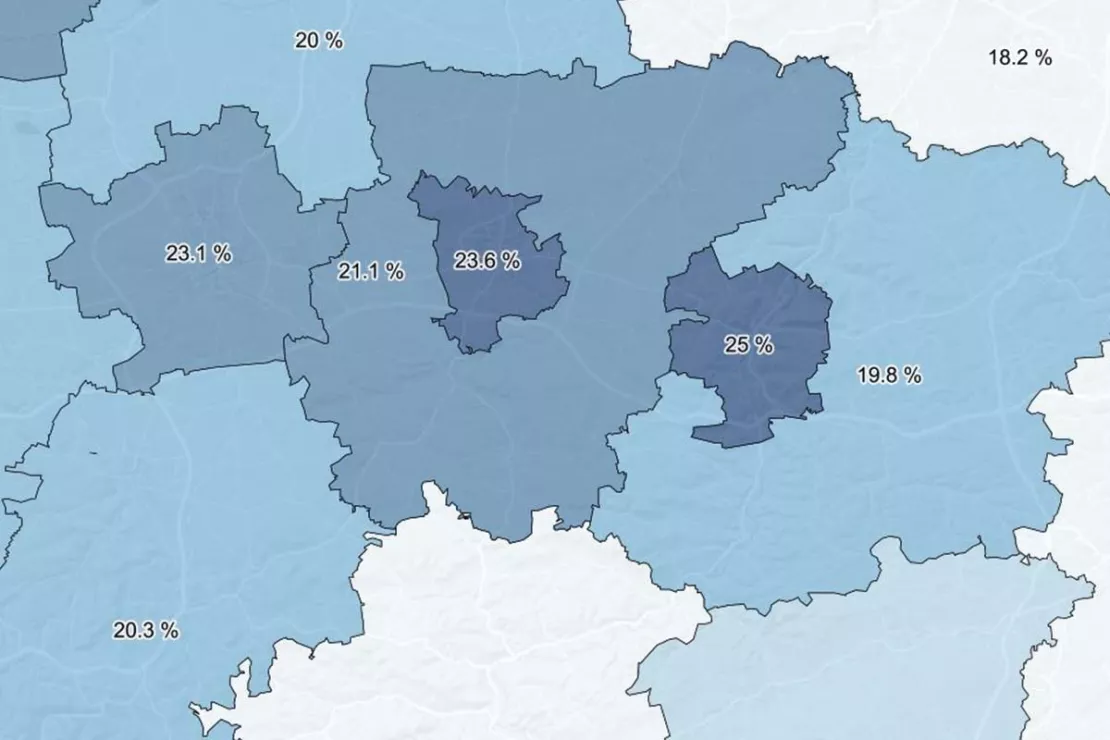
For example in the picture on the right: The darker, the higher the market share there.
Tip!
Do not be afraid of incomplete/imperfect data. All the information is not always available. Try to get as close as you can, because “fuzzy” data is better than no data! Knowing that there are inaccuracies in the analysis will help you more than no market analysis at all.
Test for yourself - Calculate Market Shares with WIGeoWeb
4. Market Penetration Analysis
So far we have been working with actual sales. Market penetration analysis is about sales/turnover forecasts for the future. In the example above, where you sell 50 car batteries in district X, your market volume is 200 batteries because you know the number of cars and each car has a battery. However, the market penetration could be higher, namely if the market for cars grows, so it can be expected that the number of cars will increase. In the early days of mobile communications, only a few mobile phones were sold in relation to the number of inhabitants. The market later developed so that multiple devices were possible per inhabitant. Market exploitation indicates the extent to which potential possible customers of a product actually consume it.
It is clear that you have to make assumptions for a penetration analysis. Surveys can show how much demand there is for a product that is still unknown.
Questions Answered by a Market Penetration Analysis
- What is the maximum amount I can sell?
- I am considering further developing my product. Is there any demand for it, is it worth it?
- Where are my potential customers?
- Where is there potential?– Or the other way around:
- I am expanding. Where should I open new branches or make customer service areas smaller?

WebGIS is designed to link all relevant factors together and to show the results in a spatially distributed manner. If necessary, it can also be analyzed on a very small scale, which pays off in branch location decisions for example.
Penetration analyses work, and we can say that from experience. They help you to increase your earnings.
5. Competition Analysis on Maps
The competition analysis gives you an overview of your competitors and thus your own position in the market, which you can then adjust, even on a small scale. The competition analysis is often neglected, not least because it is difficult: A lot of data is not available or is secret. However, it pays off to analyze the strengths and weaknesses of your competitors and to draw conclusions for your own business.
There are numerous sources for this: Online research & other publications, personal contacts, your own sales representatives, customers, trade fairs, associations and much more.
Questions Answered by a Competition Analysis
- Where is my competition located, how is it distributed spatially?
- Where is the competition strong / weak?
- How can I optimally position my company?
- Where can I expand my market share, where is the effort not worth it because the competition is too strong?
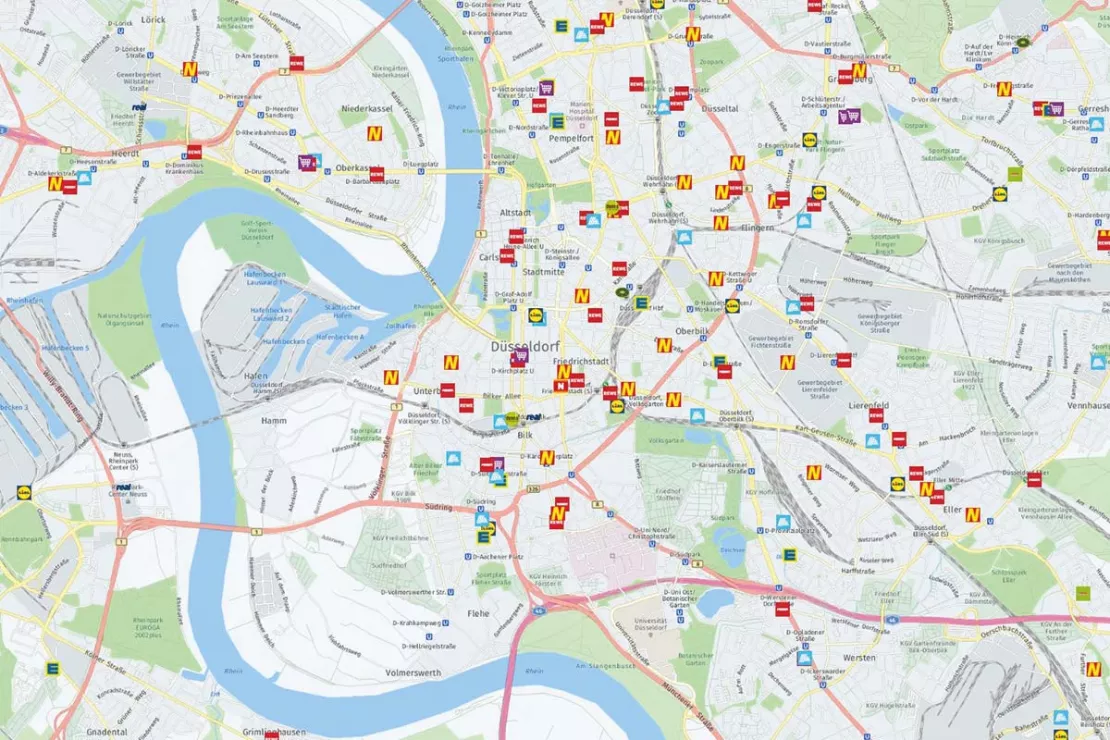
Through a spatial analysis of your competition, you can assess your own sales potential spatially, regionally and more realistically. You can critically question your sales department and make adjustments. Also if you plan to expand, you should always analyze the competition.
Almost all of the questions mentioned so far can also be asked with the focus on the competition. The market analyses presented here overlap in practice, so it is your questions that are crucial. The advantage of WebGIS as a central system for your market analyses is also evident here: you have everything in one system and can flexibly switch between or combine disciplines.
6. Spatial Portfolio Analysis
As the sixth analysis, we introduce a powerful tool: spatial portfolio analysis. This method helps you combine multiple performance and potential factors, uncover relationships, and make data-driven strategic decisions.
With spatial portfolio analysis, you can evaluate sales territories, branch networks, or dealer locations in a geographic context. Each point in the matrix represents a branch, a sales area, or a postal code. Performance indicators such as revenue, sales figures, number of customers served, or store size are analyzed alongside market potential.
Your spatial market potential depends on your business and products—see our market penetration analysis for more details.

The graphic illustrates an example analysis of a company's sales areas. Each point represents a sales area.
- Sales areas in the upper right quadrant (Stars) have high market potential and also perform well.
- Sales areas in the lower right quadrant (Cash Cows) perform well, although their market potential is low.
- And so on...
The main focus is always on the Question Marks. In this quadrant, the company has potential that it is not yet exploiting. This is where you need to take action.
The matrix provides a quick overview of the market situation. The insights can be used to steer your business and increase revenue.
Questions Answered by a Spatial Portfolio Analysis
- Which sales areas have high potential that I have not yet exhausted?
- Which branches (locations) should I close?
- Where (at the ZIP code level) can I find an especially large number of online-savvy buyers for my products, broken down by product category?

You can carry out the analysis directly in WIGeoWeb. You can see at a glance where your Cash Cows and your Poor Dogs are in your market.
A wide variety of data flows into the values for performance and potential. Further fine tuning is possible by weighting: Play with the weighting and see how the points move in the matrix. This helps you plan measures and make strategic decisions.
Tip!
The portfolio analysis is an ideal basis for translating strategies into operational measures. You now know where you need to take action. It is important to monitor the measures using target/actual comparisons and to adjust them if necessary.
Performance vs. potential – identify regional growth opportunities.
The Right Data for Geomarketing Success
If you’ve read this far, it should be clear: The availability and quality of your data is a key factor for your market analysis. On the one hand, we warned you against even performing the analysis if you lacked perfect data, and on the other hand, of course, your market analysis can only be as good as the data you use. Since it can be time-consuming and/or costly to get good data, it is a matter of weighing the effort versus the benefit.
We basically differentiate between internal and external data.
Internal data is your company data, e.g. the data from your CRM system, your sales figures etc. The problem is often not the lack of availability, but exactly the opposite: you have more than enough information, but it is scattered throughout the company in different departments and IT systems. In order to be able to use the data sensibly, it first has to be collected, sorted, standardized and adjusted, or in other words: integrated. If this has not already been done, it is worth investing in your own IT or getting external help. Good data management is not set up overnight.
External data, including market data or “demographic data”, are all data that you do not generate yourself in the company, but which you need for your analyses, such as the already mentioned data on target groups, market volumes, competition etc. Much of this data is available free of charge or is open source, but sometimes it is necessary to purchase data, or it is worth it for reasons of quality and efficiency.
Here the German and Austrian markets differ fundamentally in some points, which is good news: There is good data for both markets. However, you have to know where to find it, what to look for and the granularity you need. We have compiled interesting information on demographics for you.
Conclusion
Market analyses are essential for making the right decisions in your company. The analyses presented here do not have to be performed in a specific order, but are valuable instruments that can be used as required. They answer questions from every area of your company: strategy, product development, marketing, branch location decisions and sales.
Market Analysis Tools like WIGeoWeb focus on spatial relations and have the advantage over other methods that questions can be answered very regionally and even on a smaller scale if required. For example, submarkets can be analyzed. Another advantage is that numerous analyses can be carried out with just one tool, including the six presented here.
Tip!
The clearer the facts on the table, the better you can manage your company. Market analyses provide these facts. It is often necessary to convince colleagues from other departments. Market analyses provide you with arguments!
Test WIGeoWeb Free - Start Your Analyses Now
- Non-binding, free test for 30 days
- Test ends automatically without cancellation
- An employee will explain the tool in a short webinar*
* Information about the free test access: Standard regions with selected data in Germany or Austria will be made available. In Germany, these regions are districts in Munich and environs, and districts of Vienna and environs in Austria. The products of WIGeoGIS are intended for companies and are not suitable for private use. If you need a one-time market analysis, we will gladly make you a service offer.
Read our customer success stories on market analysis.

Case Study WebGIS: This is how CLAAS uses WIGeoWeb
Potential analysis, market analysis and territory management all with one WebGIS! Yes! CLAAS has been using its own WIGeoGIS WebGIS to answer many questions since 2014.
WIGeoWeb in Real Estate Appraisal
For example, Real(e)value enhances its proven, high-performance real estate appraisal tool by spatially representing the data using WebGIS.

Crédit Agricole: Market potentials via GIS
To keep up with the constantly growing needs of microgeographical analyses, the Polish subsidiary of Crédit Agricole uses a GIS by WIGeoGIS.

Geodata in Health Insurance - The AOK Nordost
Healthcare planning: The AOK Nordost relies on GEOmarkets and other tools from WIGeoGIS to optimally provide their policyholders with doctors and preventive healthcare services.
Find detailed information here about the most common market analysis methods.
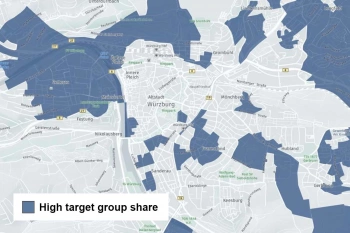
Target Group Analysis and Geomarketing
Target group analysis with geomarketing reveals regional potential and its distribution.
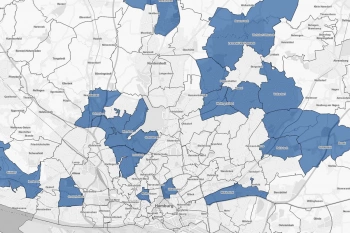
White Spot Analysis: Detecting White Spots
White spot analysis, the key to your potential regions! Be it for branches networks, retailers or sales. You can easily identify the best places for your business!
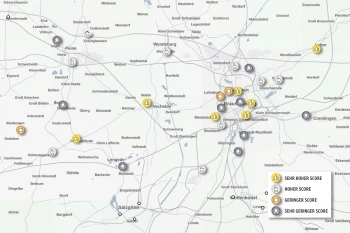
Scoring Model for Location Analyses
Scoring analyses are ideal for evaluating locations quickly and clearly. They are also perfect for comparing multiple locations at once.

Analyze Market Penetration
With geomarketing you can find potential customers, turnover and sales! Compare your company key data with current market data on a small scale.
FAQ
-
How can I best use spatial market analyses in day-to-day business management?
Use spatial market analyses with WebGIS software to make regional and data-based decisions. The software shows you current market and company key figures, such as market shares or regional potential. Standardized, automated reports enable continuous monitoring.
This allows you to identify opportunities or problems at an early stage and derive targeted measures in marketing, sales, or employee development. This leads to more efficient processes and better results in day-to-day business.
-
How can I successfully integrate spatial market analyses into business practice?
Use a WebGIS such as WIGeoWeb and integrate clear routines: define requirements, introduce the tool properly, and provide targeted training for employees. Start with small, quickly visible successes to build acceptance.
If the analyses are used regularly in reports, meetings, and decisions and communicated internally, they will automatically become an integral part of everyday work.
-
What do I do if I don’t have the necessary data?
This is a good question and a common problem, but it should not keep you from performing analyses. A shoe retailer, for example, would like to analyze its sales in Austria by region. But he does not even know where the shoes are sold, since he only knows the data of the central warehouse in Salzburg. In practice, you try to answer the question using the best available numbers, and there are often good workarounds. Better an analysis with a larger fluctuation range than none at all!
-
Do the individual market analyses have to be carried out in a specific order?
No, market analyses are used as needed and can complement each other. For example, potential analyses are often incorporated into customer analyses: a customer with greater potential does not automatically generate the highest sales—A/B/C categorizations based on sales figures are helpful here. In practice, you can choose the analyses flexibly and depending on the specific issue, often in combination.
-
How does regional market data help with target groups and potential analysis?
Market data can be used to examine the relationship between the regional sales success and the dominant socio-demographic characteristics in the area. If a target group is identified, we can then search for other regions that have a particularly high share of this target group we know generates success.
-
Why are digital maps better than tables for data analysis?
Digital maps make it easy to visualize spatial relationships at a glance because the human brain processes visual information much faster than plain text or numbers in tables. On interactive maps, you can immediately see how districts, municipalities, or postal code areas relate to each other—something that’s hard to grasp from tabular data alone
-
Can I analyze my markets at a very detailed level with WIGeoWeb?
Yes. WIGeoWeb allows you to view data at any spatial level you Need - from large regions down to small units such as municipalities or postal codes. If required, you can even drill down to raster cells of 100x100 meters, enabling precise aggregation of market and sales data for your specific sales territory or area of responsibility.
Are you interested in the advantages of Market Analysis Tool WIGeoWeb?

