Demographic Market Data for Germany
Current population statistics, age classes, housing situation, family structure, income classes, life phases, purchasing power as well as hundreds of other characteristics are provided by WIGeoGIS as market data for Germany. Demographic data spatially processed. Updated annually.
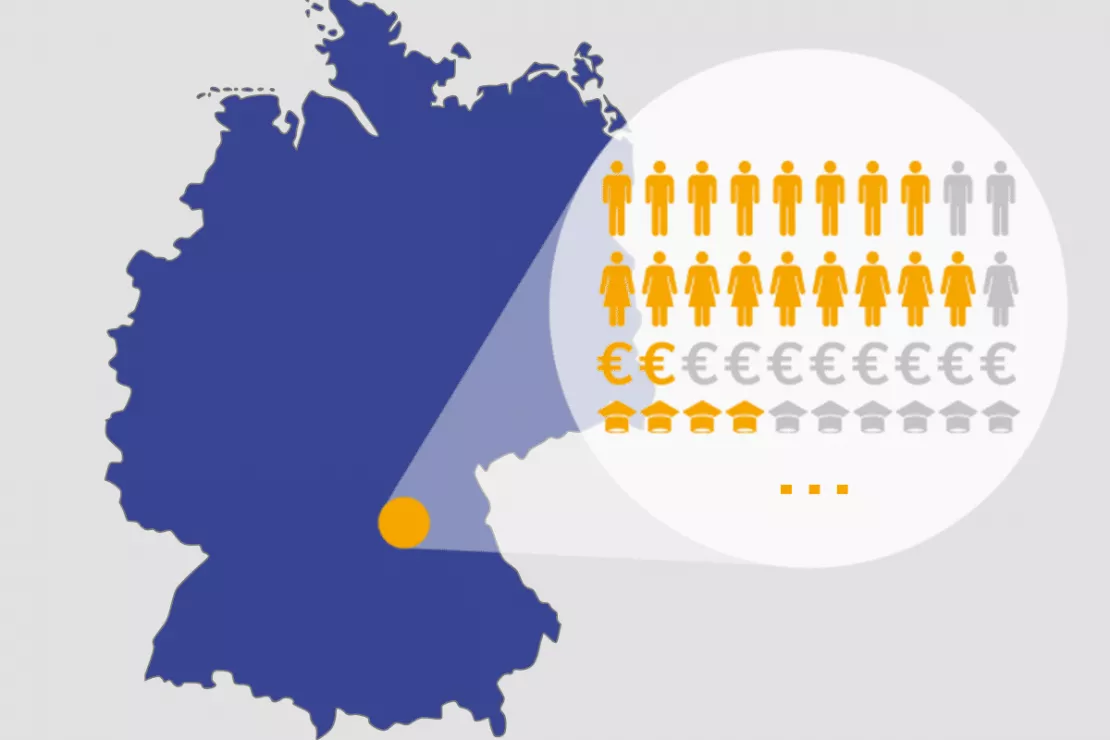
From Aachen to Zwickau
- Inhabitants, daytime population
- Population structure (age groups, gender, nationality, life stages)
- Employed/unemployed
- Purchasing power
- Households by size, income class, housing situation and children
- Family structure
- Buildings, residential buildings, apartments
- over 250 further data sets
Germany Demographics. Up-to-date. Check the high quality.
Germany Demographics
Take a Look at the Map
Did you know that Hisel in Rhineland-Palatinate is the community with the highest percentage of people over 65 in Germany? 60% of the population belongs to this age group. Only 12 kilometers away is Kaschenbach, where only a mere 3% of the population is over 65.
In this area it can easily happen that marketing activities are wasted on the wrong location. That is, unless you take a look at the map! Because with the right demographic data and a geomarketing analysis, the connections are immediately visible. The same that applies to the age structure also applies to the other characteristics of your customers and target groups.
If you know where customers and potentials are, you can focus your activities in the right place. Therefore, market data is often used for sales territory planning, branch network optimization and target group analysis. If your target group is in Germany, you can use demographic data for many such analyses. Demographics, such as that for Germany, can be “broken down” at various levels, for example by municipalities, cities, districts and administrative districts within Germany.
- Recognize market penetration analysis
- Create demographic customer profiles
- Analyze and optimize branch locations
- Differentiate markets
- Control your sales
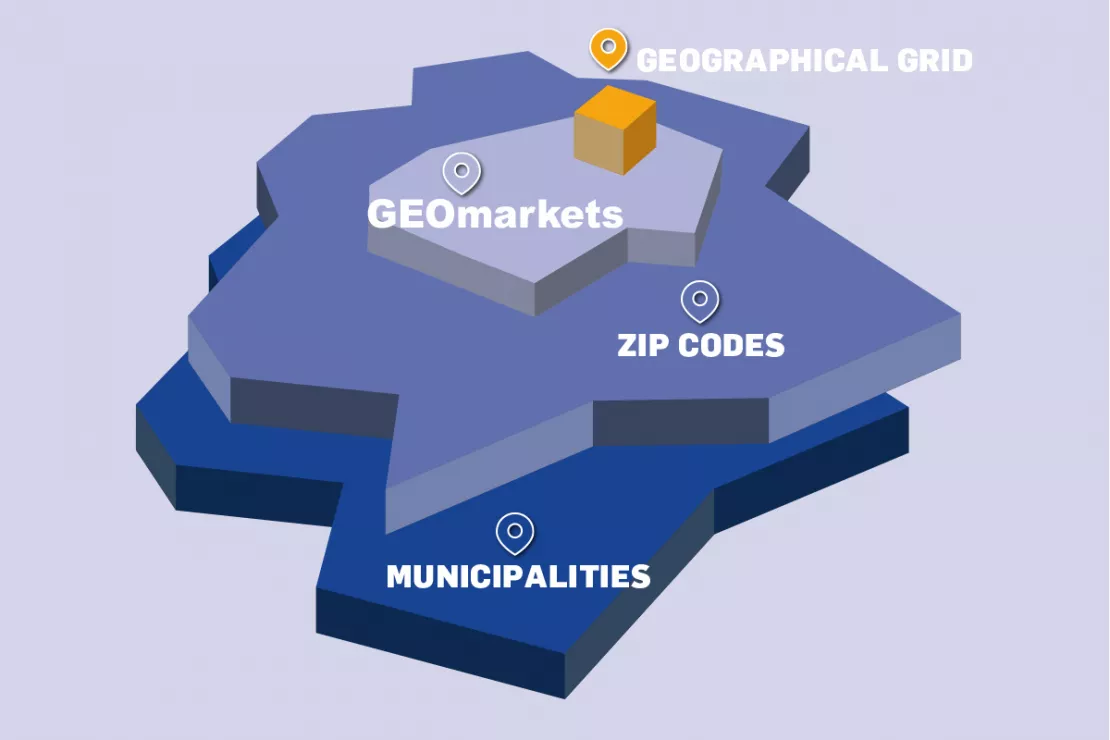
Available spatial levels in Germany
- Municipalities (average 7,490 inhabitants)
- Postal codes (average 10,160 inhabitants)
- GEOmarkets (average 440 inhabitants)
- Grid cells in different sizes e.g.
- 250x250m (average 69 inhabitants)
- 100x100m (average 23 inhabitants)
Explore our Germany Demographics and Data Sets
Demographics Germany 2025/2026
Demographics Germany - population, age, purchasing power. And whatever else you want to know. WIGeoGIS is your specialist for demographic data.
GEOmarkets: Regional Demographics for Germany
GEOmarkets are ideal for small-scale market analyses. They comprise an average of 300 households and take ZIP codes and municipal borders into account.
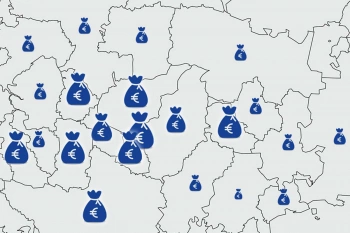
Purchasing power data - Knowing where people are consuming
Purchasing power data provides information about the level of prosperity and willingness to consume. We offer purchasing power data according to product and people groups at the ZIP Code level and smaller scales.
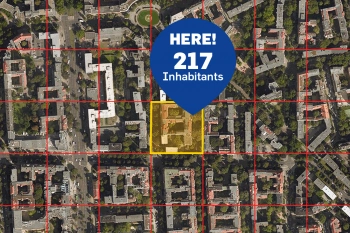
Regional Demographics in Geographic Grid Cells Germany
The AZ Germany-Raster includes regional market data for Germany in geographic grid - always equal areas of 100 x 100 m up to areas of 10 x 10 km.
Test our demographics for Germany for free and without any obligations!
German Demographics at the Right Spatial Level
Depending on the data product, demographic data is available in different spatial units. You can choose from raster cells, which are ideal for small-scale analyses such as location analyses (up to 100x100 m) and whose boundaries never change, which is advantageous for some analyses, as well as units at the ZIP code and community level. They are suitable for most regional analyses and provide better results when you want to gain an overview. “That is also a cost factor,” explains Marcel Kirrmann, Manager at WIGeoGIS. “After all, you do not want to shoot sparrows with cannons.” Tell us your requirements and we will ensure you get the best price possible.
4 Reasons to Get Your Data from WIGeoGIS
- Best price performance ratio: There are as many license models as there are data providers. Depending on your requirements, the same quality of data may be less expensive from one or the other provider. This can result in a price difference of 50 percent or more. We will find the best deal for you!
- Independent: We are like a well-stocked specialty store. We have an overview of the market, access to a worldwide universe of data providers and can select the best product for your needs. We are independent and committed to making decisions in the best interest of our customers.
- 30 years of experience, always in touch with the times: Through our more than 30 years of experience in countless customer projects, we know the data provided by our partners down to the last detail. We know about the methodological differences and spatial units. We are constantly updating our portfolio and exploring the market for new, innovative data products.
- Everythingfrom a single source: If you need more than one data product, we are your single source for all your data needs. We will take care of all the licensing and save you the administrative overhead.
Save Costs with Good Advice
“It is important for us as a customer that the service provider offers quality consultation without focusing on their own economic interests. From a customer viewpoint, WIGeoGIS provides good honest consultation. For example, WIGeoGIS made a different data source accessible that helps ease the budget for the ANWR GROUP.”
Hans-Peter Richter, ANWR GROUP
Demographics Germany: Test now free of charge and without obligation!
- Test data* on demographics, purchasing power or other characteristics
- Non-binding, free test
- Test ends automatically without cancellation
- Receive test data* as Excel or shape file
I will gladly support you, also by telephone.
* Information about the free test data: Selected test data for Germany is available for districts in Munich and the surrounding areas. The products of WIGeoGIS are intended for companies and are not suitable for private use. If you need a one-time market analysis, we will gladly make you a service offer.
FAQ
-
Can I actually link different demographic characteristics in my analyses?
Of course, this is the alpha and omega of data analysis and provides very accurate answers. For example, a question might be: Show me all people under 35 (age structure), who live in one- or two-family houses (building size) and have an above-average purchasing power. The results are displayed on a map showing you at a glance the regions in which you can best reach your target group.
Try it out now! Request your test access to Market data Germany today for free with no obligation.

