Customer Analysis
Segment Customers, Understand, Visualize and Find New Customers with WebGIS
With the help of a customer analysis, companies examine and segment their existing customers and potential new customers. Using WebGIS software gives even better results. This is because customer data and potential are ideally visualized on a map (e.g. Bing Maps) and analyzed spatially. As a result, companies gain insights that would have remained hidden without the geo reference. Your company can also benefit from WebGIS and geomarketing.
Content
- Questions Regarding Customer Analyses
- Display Customers on a Map
- Customer Segmentation
- ABC Analysis and Customer Value
- Discover Potential & Find New Customers
- Aggregation of Customer Data
- Integrate Customer Data into GIS and Data Protection
- These Companies Use WIGeoWeb for Customer Analyses
- Contact and Free Test
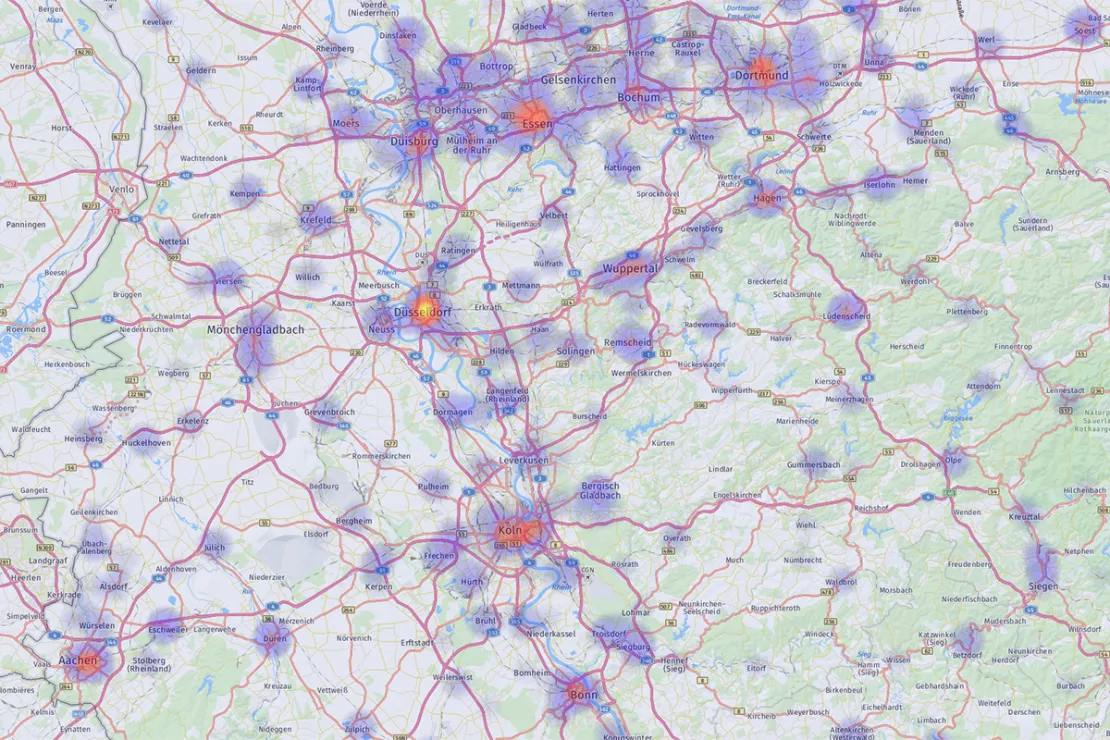
Customer density with WebGIS - hot spots become visible
Benefits of Data Analysis with WebGIS
Most companies analyze their customer data. Using a WebGIS to do so provides companies with the following additional benefits:
- Answering all key questions of the customer analysis + spatial aspects
- Analysis of customer data on a map
- Visualization of customers and potentials on a map
- Standardized processing of large data sets
- Quick and easy to use as an online tool
Test it yourself! Customer analysis with the WebGIS WIGeoWeb
Questions Regarding Customer Analyses
With a geo-tool, you can not only answer customer analysis questions one-dimensionally, you can also see analysis results on a map to help you better understand relationships thanks to the spatial reference. This enables you to make faster decisions and take concrete operational actions.
Through customer analysis with WebGIS you know…
- not only WHO, but also WHERE your existing and potential customers are
- not only WHO, but also WHERE your A, B and C customers are
- not only WHO your target group is, but also WHERE you can find your target group and potential new customers
- the expectations and requirements of your customers by municipality, ZIP Code and/or sales area or catchment area
- WHERE customers are satisfied and WHERE they are not
- WHERE your customers buy or reject WHAT products
- WHERE your competition is particularly strong and active.

Customer analyses with the WebGIS WIGeoWeb show you WHERE you can find potential new customers and how strong the competition is in those areas. This allows you to better estimate where it will be easier to acquire new customers and where greater effort will be necessary.
Customer Analysis with WebGIS - Test all its functions for free with no obligation!
Display Customers on a Map
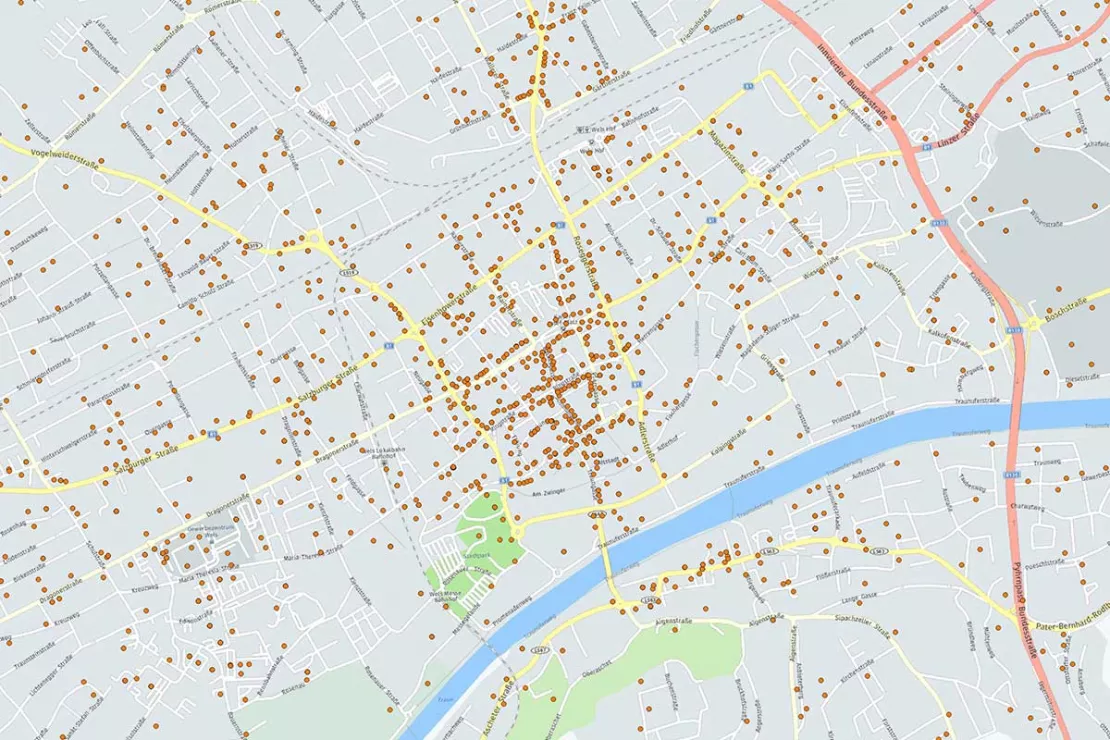
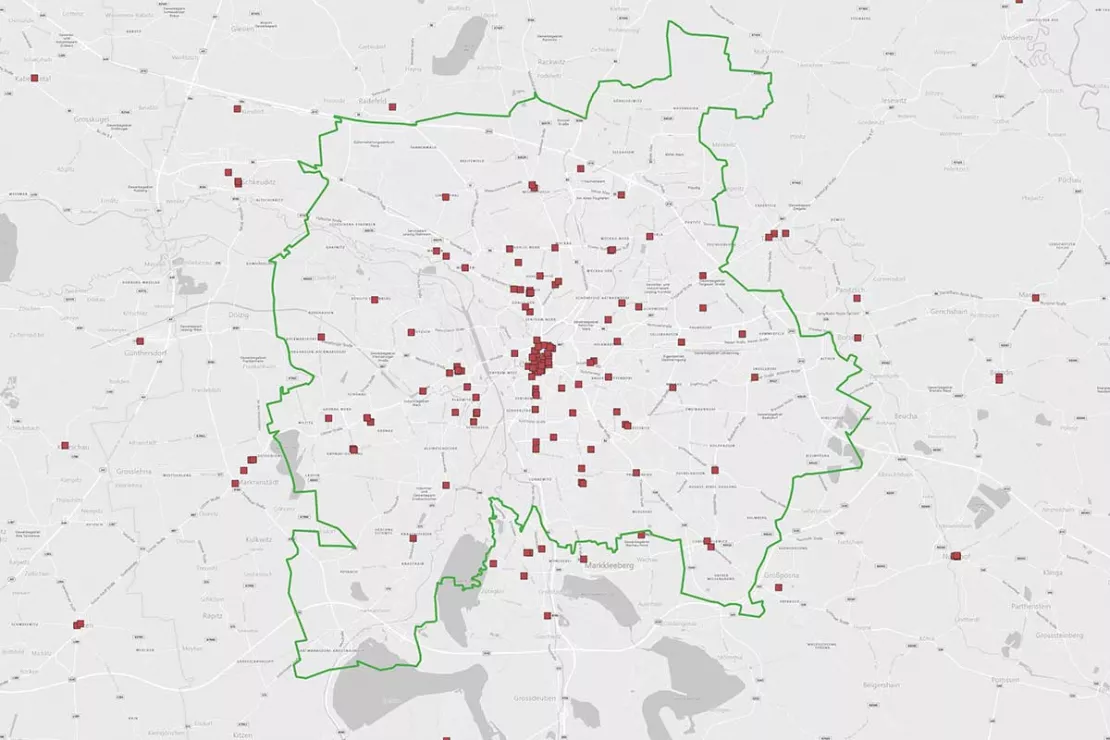
A first and very helpful step to get an idea of the distribution of customers in the market is to display the customers on a map. Where do you have a lot of customers and clusters? Where are there white spots and hidden potential?
Visualizing customer data on a map is the starting point and the prerequisite for all further spatial analyses.
Customer Segmentation
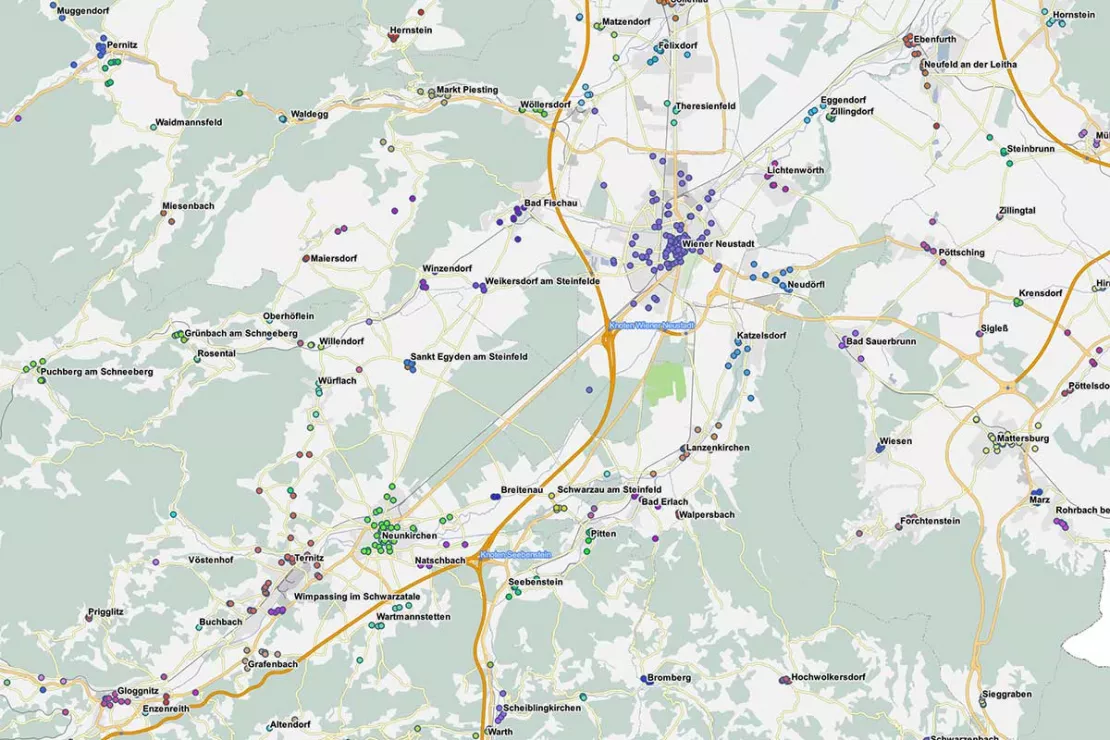
You can segment your customers by industry, job position, demographics, buying behavior, geography, attitude and values. The question of where you can find your customer segment is answered by visualizing the information on interactive maps.
This is how you find your customer segments and then determine appropriate sales and marketing measures to reach them.
ABC Analysis and Customer Value
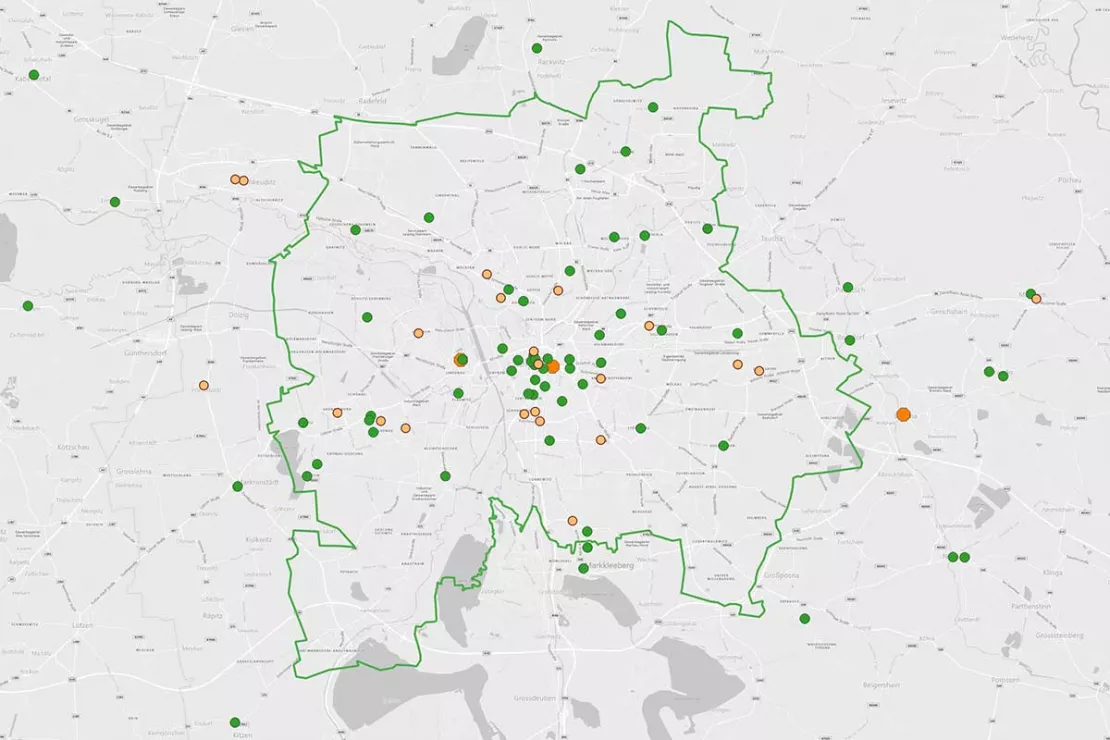
With the help of the ABC analysis, companies or people are divided into important and less important customers. Group A is the most important customer segment. The sales and marketing measures are particularly intensive here. Geomarketing allows you to visualize this analysis. What are the benefits? You will receive answers to the following questions:
- Where are customer clusters?
- Where do I have white spots?
- How are the individual customer segments distributed?
- Where are which sales and marketing measures necessary?
Discover Potential & Find New Customers
Customer analyses with the WebGIS WIGeoWeb show you WHERE you can find customer potential and how strong the competition is in the region. Fields of application are:
- Find potential retail locations and define customer service areas.
- Analyze catchment areas. The results of the environmental analysis provide hints for not yet discovered potential demand.
- Find areas populated by people with similar socio-demographics and affinities to your customers.
- Find areas where your target groups live or work.
In this way, you can better identify areas where there is sufficient market potential for acquiring new customers.
Aggregation of Customer Data
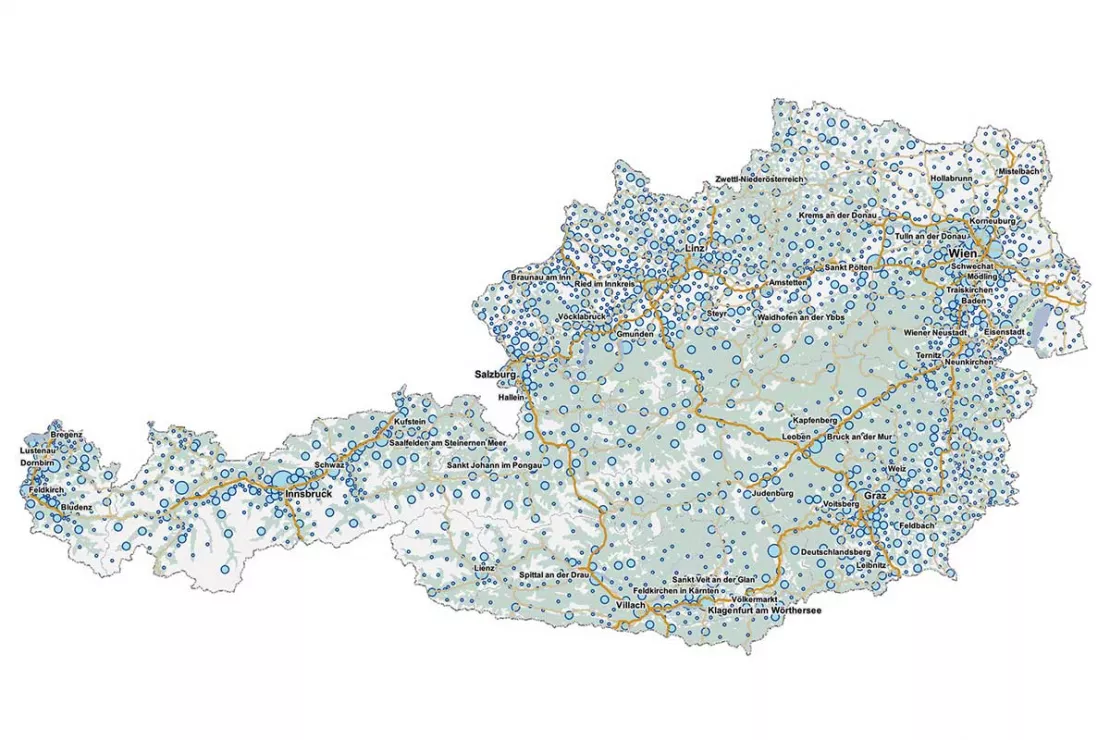
When aggregating customer data, data is combined and displayed on a larger, spatial level.
This is useful, for example, to help find “white spots” (= White Spot Analysis) or make area-related comparisons. Questions like: “Where are the sales exceeding or falling below my expectations?” are answered using aggregated customer data. In addition, the aggregation offers maximum anonymization of the customer data.
However, due to the anonymization, ABC customer analyses and customer segmentations are no longer possible. On the other hand, potential analyses are possible.
Can I analyze customers on a map? Test WIGeoWeb for free and with no obligation!
Integrate Customer Data into GIS and Data Protection
You can integrate any data you like into our WebGIS WIGeoWeb. There are two ways to do this:
- Data upload and download, e.g. as Excel lists
- Data integration via an ETL process (ETL = Extract - Transform - Load)
Always Keep Your Data Up-to-Date with the Help of Automated ETL Processes
The option that is most practical in everyday work and the least prone to errors is data integration via an automated ETL process. The data is automatically extracted from the databases, automatically optimized for the GIS and entered into the GIS. You determine in advance how often the data should be updated in the GIS. We design the ETL process to meet your specific needs.
Data Protection
Our WebGIS enables you to analyze customer data anonymously, if desired. This is possible by aggregating the data. In addition, data based on an anonymous customer number can be integrated. The transmission of address and contact data is not necessary. The analyses are run on the basis of the customer number, to which the corresponding coordinates and associated attributes have been assigned.
What comes after customer analysis with a WebGIS tool?
For many companies, the visualization and analysis of customer data is the gateway to further geomarketing analyses. In addition to spatial customer analyses, GIS systems can be used for many other analyses and areas, such as scoring analyses, business development, territory planning and much more. In addition to internal data and geodata, demographics also comes into play here.
These Companies Use Our WebGIS WIGeoWeb for Customer Analyses

Case Study WebGIS: This is how CLAAS uses WIGeoWeb
Potential analysis, market analysis and territory management all with one WebGIS! Yes! CLAAS has been using its own WIGeoGIS WebGIS to answer many questions since 2014.

JYSK is using geomarketing solutions
In order to grow, customers must be won away from the competition. This is only possible through a perfect location selection.

Unicredit Bank Austria: Geomarketing optimises sales structures
Using WIGeoGIS geomarketing software, UniCredit Bank Austria is optimising its sales structures based on physical branches.
Customer Analysis with WebGIS: Fill out the form, test it free of charge & without obligation!
- Non-binding, free test for 30 days
- Test ends automatically without cancellation
- An employee will explain the tool in a short webinar*
FAQ
-
Will my customer data also be geocoded in the tool, i.e. provided with coordinates?
Yes! When you import your data, it is geocoded so that it can be displayed on a map and used for geographical analysis. The prerequisite is that every customer data record has an address. Alternatively, customer data can be aggregated to ZIP Codes or administrative units.
-
Can you also use external data, such as market data, for customer analysis in your tool?
Yes, that is possible and makes sense. If required, we can also provide you with market data. The advantages of geographic information systems are obvious. By connecting your customer data and external market data, you can visualize potential, white spots and competitive situations and plan appropriate measures.
-
Which software products do you offer for customer analysis?
For customer analysis you can use our WebGIS WIGeoWeb or the desktop system WIGeo QGIS.
-
What are the benefits of a customer analysis with your WebGIS and QGIS systems?
In our GIS systems, different data from different data sources, such as CRM, ERP systems, are integrated and comprehensively analyzed on the map. Data integration is easy and possible via upload or interface. You can feed the analysis or planning results back into your management systems.
-
What is spatial customer analysis?
In spatial customer analyses, your customer data is visualized on digital maps and analyzed according to different criteria. This allows you to answer questions like: Where do I have high or low sales? Where do I have many customers in a specific customer segment? Where have I sold a high number of Group A, B or C products. Where is my competition strong?
-
Can you segment customers in a geographic information system?
Yes, you can segment customers according to different criteria, for example by target groups, turnover, sales, complaints and much more. You can also segment your customers by retailer affiliation. This gives you better insight into your markets.
-
Can you visualize sales or turnover per product group or retailer in a GIS?
Yes, a GIS will allow you to do that. With our GIS systems you can visualize sales or turnover either at the customer or the retailer level, as well as in an aggregated form, e.g. based on ZIP Codes, the sales territory or retail area or any other geographical company structure.

