Traffic Data for Accurate Mobility, Location, and Market Insights
Traffic data offers valuable insights into mobility patterns, traffic flows, and commuter movements. It is an essential resource for mobility analysis, traffic planning, and geomarketing.
TomTom Traffic Data – Direct Access via WIGeoGIS
WIGeoGIS gives you access to high-quality traffic data from TomTom: available worldwide, updated by the minute, and detailed down to individual road segments. Whether you're evaluating new locations, optimizing opening hours, or analyzing mobility patterns—these real-world movement data empower you to make informed decisions.
As an official TomTom partner, WIGeoGIS provides access to the MOVE platform for traffic data and mobility analytics.
What Traffic Data is Available?
- Number of vehicles per road element or area (traffic density)
- Average speed driven
- Highly detailed traffic data by weekdays and times
- Commuter flows, O/D Analysis (Origin Destination Analysis): From where to where do vehicles and people move? – can be viewed by ZIP Code, district/county or by raster cell
- Junction Analysis – where do vehicles come from and where are they going?
Find out how traffic data can also support your projects.
Benefits of TomTom Traffic Data
- Very small-scale analyses based on road elements
- Very precise planning of routes/arrival times using actually measured data in addition to lengths, speed restrictions, road classes etc.
- Current, highly valid data from over 80 countries
- Historical data available back to 2008
- Available via web app or API
- Standard formats like GeoJSON, Shape, CSV etc.
- Easy queries, quick results
- Different output options (geographical, graphic, matrices etc.)
TomTom traffic data enables you to make precise, data-driven planning and decision-making.
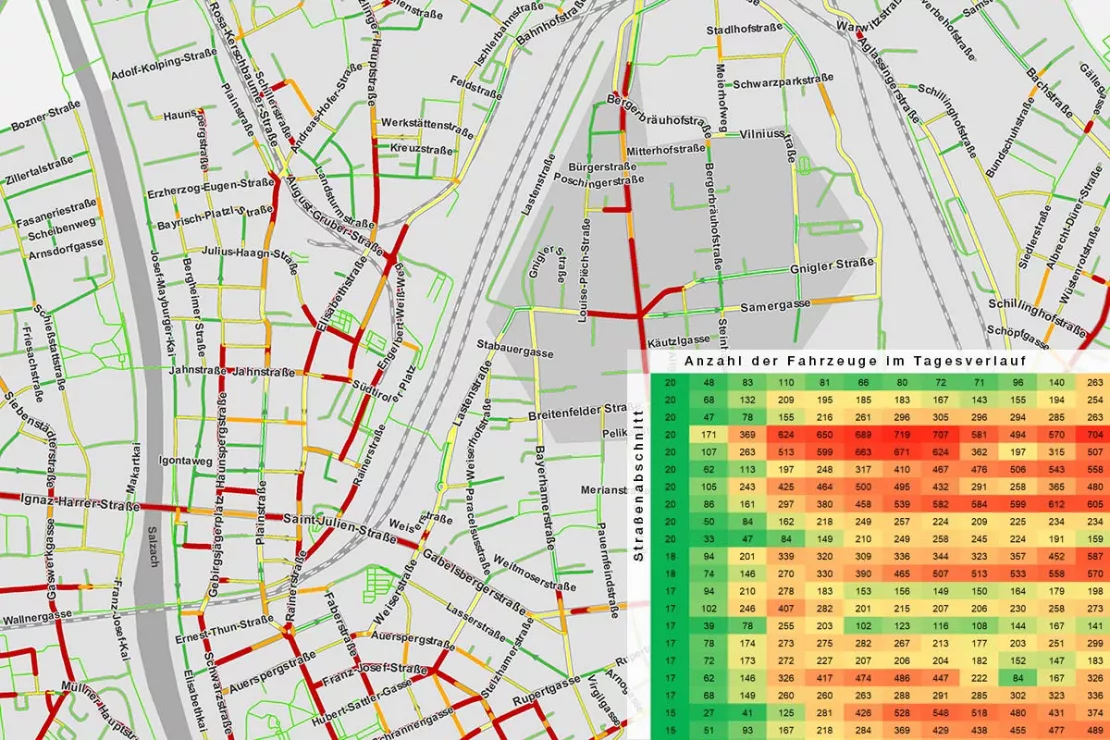
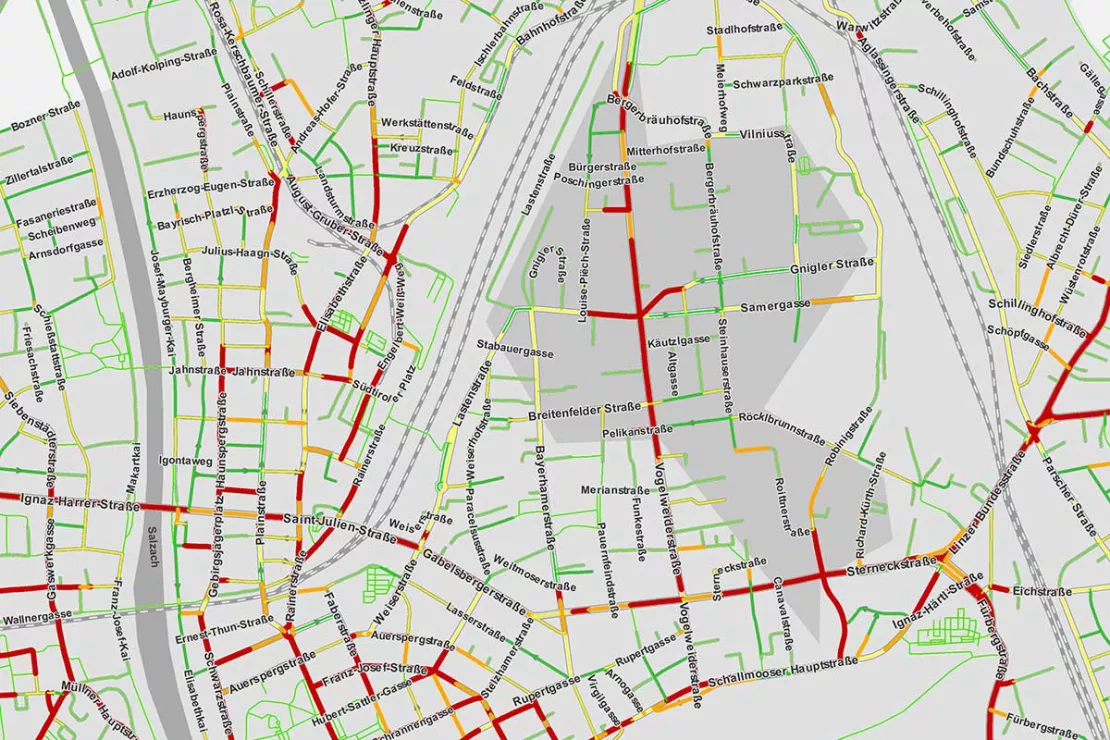
Analyze traffic on every road segment
Traffic statistics can be evaluated in many ways. The data provides key insights such as average and median speeds, speed limits, road types, and travel times — enabling data-driven decisions for the entire road network across more than 80 countries.
- The map shows the absolute speeds at a certain point in time (red = slow, green = flowing).
- The table provides details on vehicle flows on individual road elements (abscissa) at different times of day (ordinate).
6 Practical Use Cases for Traffic Data
Location Analysis
You are planning to open a gas station or a retail location and have already shortlisted a number of properties. In addition to other data used in the location analysis, traffic data provides further valuable information.
Target Group Analysis
You have a retail location in a commercial park with a large parking lot and want to know where your customers come from so that you can get to know your target group better and advertise accordingly. The Origin Destination Analysis data from TomTom provides you with the answers.
Optimization of Opening Hours
For example for a grocery store: Compare your cash register data with the TomTom traffic volumes to determine exactly if they match your opening hours.
- Are you exploiting your full potential?
- Are you open for too long?
It can pay off to close fifteen minutes later, because you might be missing out on revenue — or earlier, to save on staffing costs. The traffic data is very precise.
Unlock the Full Potential of Out-of-Home Advertising Sites
With advanced analysis of individual OOH sites - especially flexible formats like rotating boards and digital displays - you can tap into entirely new opportunities. TomTom traffic data reveals exactly when vehicles speed by, slow down, or stop, and highlights seasonal trends such as holiday peaks. This empowers you to place your clients’ campaigns with pinpoint accuracy - both in time and location.
By using Origin Destination Analysis or junction analysis of locations, you can help your clients reach their target groups directly.
- Who’s driving past your OOH billboard?
- Is the purchasing power of those passing by average, low, or high?
With these insights, you can offer your clients data-driven, high-impact placements that maximize visibility and ROI.
Intelligent planning for logistics
TomTom's accurate traffic data—including real-time information and historical analysis—provides a reliable basis for optimizing transport processes. Logistics companies and logistics solution providers benefit from:
- Efficient route planning using up-to-date speed and travel time data
- Early detection of delays and bottlenecks in traffic flow
- Improved modeling of transport networks based on sound traffic analysis
This not only reduces costs and shortens delivery times, but also makes the entire supply chain more resilient and transparent.
Traffic Planning/Urban Planning
- Where are the hot spots, where and when are there traffic jams?
- What changes in the road network are needed?
- Who is moving from where to where?
- Where should subway and tram lines be extended, commuter train intervals condensed, etc.?
Traffic data going back to 2008 makes it possible to conduct comprehensive time series analyses.
The scenarios show the range of user groups that benefit from traffic data. Retail, logistics, transport, tourism, gastronomy, public administration are just a few of them.
Take advantage of the quality of TomTom data—available directly through WIGeoGIS.

Understanding Movement
Gain deep insights into how mobility patterns evolve by Origin Destination Analysis. Using anonymized data, you can uncover movement trends that help:
- Optimize public transport schedules
- Improve infrastructure planning
- Identify ideal locations for services and businesses
This data-driven approach supports smarter decisions in urban development, mobility management, and location strategy.
Traffic Data: Test now free of charge and without obligation!
- Test data*: Number of vehicles throughout the day, traffic flows
- Non-binding, free test
- Test ends automatically without cancellation
I will gladly support you, also by telephone.

FAQ
-
How does WIGeoGIS support the procurement and use of traffic data?
WIGeoGIS is an authorized TomTom distributor. As an official TomTom partner, WIGeoGIS enables companies and organizations to access the MOVE platform for traffic and mobility analysis. Contact us for test data or trial access.
-
What is the TomTom MOVE Portal?
The TomTom MOVE Portal is a platform for traffic analysis that provides historical and current traffic data to support urban planning, traffic management, and location decisions.
-
Who are the traffic data suitable for?
Traffic data and the MOVE platform are designed for urban planners, traffic authorities, businesses, marketing teams, and anyone interested in analyzing mobility patterns.
-
What traffic data are available?
- Historical traffic data (speeds, travel times)
- Origin Destination Analysis
- Real-time route monitoring
- Junction analysis
-
How is the traffic data provided?
The data is available in various formats such as Shapefile, JSON, or Excel and can be integrated into existing IT systems.
-
Is the traffic data GDPR-compliant?
Yes, all data is anonymized and complies with the General Data Protection Regulation (GDPR).
-
What are the benefits of TomTom traffic data?
The data offers global coverage and can be easily integrated into existing systems.
-
What is the geographic coverage of the traffic data?
Traffic data is available for over 80 countries and is based on billions of anonymized GPS signals.
-
How up-to-date is the traffic data?
The MOVE platform provides both historical data and real-time information for precise analysis.
-
Is there a trial version or demo of the traffic data?
Yes, request demos and trial access from WIGeoGIS to explore the content and features.

Road Data for Logistics and Fleet Management
Global road data from TomTom with comprehensive routing and navigation attributes—ideal for use in logistics, telematics, transport management, and freight forwarding.

WIGeoStreet – Precise vector maps for Europe
WIGeoStreet are precise vector maps based on TomTom Multinet-R. For all of Europe and numerous other countries. Ready for use in all GIS systems.

ZIP Code Map
ZIP Code maps are used to present topics in relation to location. We provide ZIP Code maps for your geo-analyses or as pure geometries for graphic artists. Also including market data upon request.

WIGeo Location Data - High-Quality POI Data for DACH
Discover the power of WIGeo Location Data – high-quality POI and location factors for retail, gastronomy, and service industries in Germany, Austria, and Switzerland. Make smarter location decisions.
Start exploring your potential with free test data today.