From the Analysis of the Market Penetration to Sales Controlling
With the WebGIS solution WIGeoWeb, manufacturers have everything they need for data analysis and territory management.
Recognizing market penetration, optimally planning retailer networks and monitoring sales success, this is the only way manufacturers can successfully advance their business.
Are you a manufacturer of products that require explanation or capital goods and do you distribute them via
- Retailers
- Distributors
- Your own sales team?
Our online tool WIGeoWeb supports you with:
- Meaningful data analysis
- Visualization of the results on maps
- Clear reports on KPIs at the push of a button
- Market and industry data if needed
Our WebGIS solution WIGeoWeb has two key advantages over other analysis tools. First: It offers suitable analyses for a wide variety of questions. Second: It takes spatial factors into account. The analysis results thus allow you to easily determine the potential for locations and sales areas that would otherwise remain hidden without the geo reference. Complex analyses are visualized clearly and understandably on digital maps and are available online at any time.
We also have high-quality regional data that we can immediately integrate into your analyses if needed.
Would you like to test a WebGIS? Request your WIGeoWeb test account for free with no obligation.
WebGIS for Manufacturers
You can do everything with WIGeoWeb: from A, for all kinds of analyses, to C, for customer analysis, S, for sales controlling and T, for territory management and for defining realistic targets.
Market Penetration, Territory Management, Sales Controlling: All in One Tool
Nothing is more annoying than having to start a different tool for each analysis. That is why WIGeoWeb combines all the relevant analyses into one tool and has a practical upload function for Excel as well as interfaces for common CRM, BI and databases. Last but not least, the tool also provides a report that clearly summarizes all the important data.
Ad-hoc analyses and automatic reports make it easy for manufacturers of products that require explanation to identify potential and new customers, to plan ideal retailer networks and to achieve the set sales goals. Over 400 satisfied customers from different industries use WIGeoWeb for their data-driven market analyses, territory management and sales controlling.
Calculating Market Penetration
With WIGeoWeb, you can calculate the market penetration based on your own market volume and available regional data. The market penetration and opportunities can not only be identified as a whole, but can also be broken down by location and small-scale areas such as ZIP Codes, communities, statistical enumeration districts, GEOmarkets and other spatial units, also for each individual product.
With WIGeoWeb, you can answer the following questions relating to market penetration, for example:
- What is the maximum amount I can sell at location XY?
- At which of my retailer locations is there potential for my new product?
- Is there potential beyond my current retailer network?
- Where are my areas of hope?
- Where should I open new retailer locations or where are my white spots?
In addition to the market penetration analysis, you can use WIGeoWeb to carry out other types of market analysis, such as customer analyses and competitor analyses.

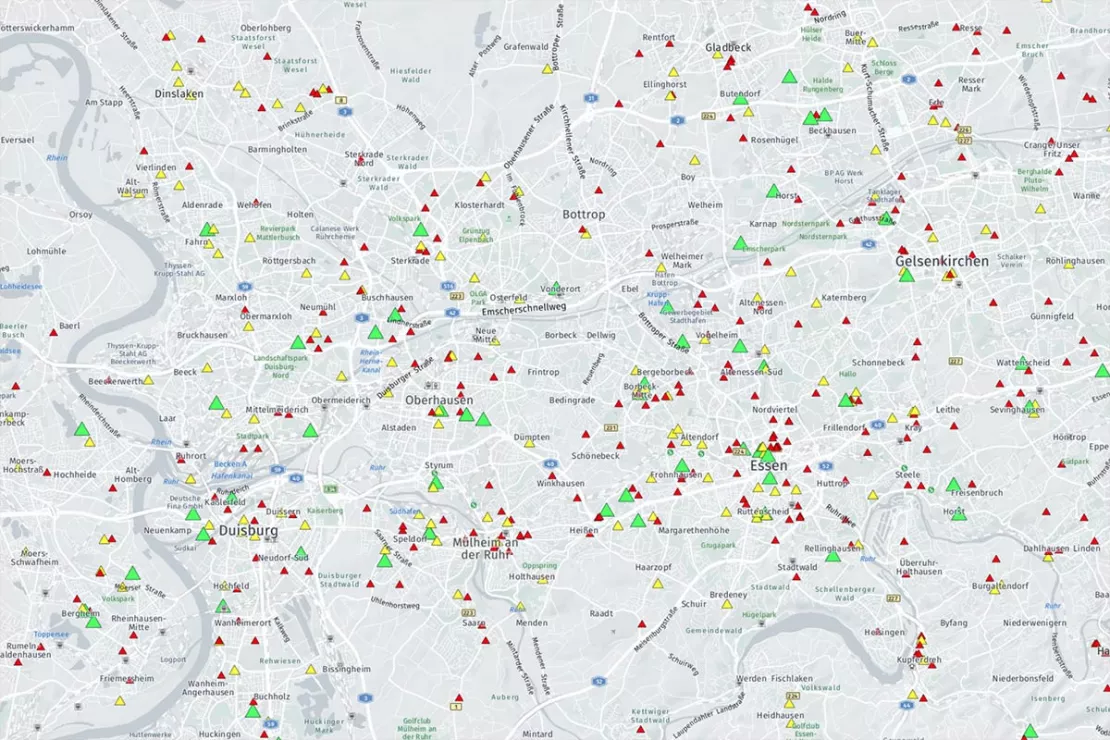
Display all your customers, or just a selection such as A, B, C customers, interactively on a map. You can see the distribution and scattering in an area. Visualize sales structures and filter them according to your KPIs.
Customer Analysis
Customer analyses help to increase the productivity of your own sales department. You examine the data that you already have about your customers and the analysis gives you a clear profile of your customers and their potential needs.
With the analyses and maps you not only see:
- Where are my customers?
- Where are “good” and where are “bad” customers?
- Where can I turn B customers into A customers?
You can also better assess:
- What additional products could my customers be interested in?
- Where is the demand for (which) spare parts particularly high?
- Where does an expanded range of services make sense and for which products?
Results from customer analyses with WebGIS set impulses for specific sales activities and marketing measures.
CLAAS is one of many satisfied WIGeoWeb customers. The agricultural machinery manufacturer uses the tool for market and penetration analyses as well as territory management.

Nato Klems from CLAAS via WIGeoWeb:
“The WebGIS provides extensive, detailed, product and market-specific information. The complexity of our markets can be clearly and easily analyzed and visualized. With the tool, employees at every level have access to current and relevant data and analyses from anywhere. The WebGIS makes us faster in analysis and decision making.”
Click here to read the CLAAS-Case Study.
Do like the leading companies. Trust in WIGeoWeb, the WebGIS software!
Location analysis for retailer networks and territory management
Portfolios of manufacturers of products that require explanation or capital goods are sometimes very diversified. This must be reflected in the retailer network, because not every location is equally suitable for selling every product. As a result, retailer networks can be very complex.
With location and sales area analyses from WIGeoWeb, you can see the potential of each location in relation to your products. On the basis of the market penetration analysis, you decide which of your retailer locations you want to strengthen, where relocations are imminent and where a closure or reopening might make sense.
With the analyses from WIGeoWeb, you also support your retailers and jointly develop strategies for more business.
With WIGeoWeb, you can answer the following questions about retailer network planning and territory management, for example:
- Which retailer locations make the most sales with which products?
- A retailer will close soon. Which location will take over the customers?
- Which location falls short of its potential?
- Which locations and areas are cannibalizing each other?
The equipment manufacturer STIHL uses our solution for location analyses and retailer network development. This is how the company unerringly reaches new target groups.

Frank Schilling from STIHL about the WIGeoGIS tool:
“In order to drive the development of the retail network forward in a targeted manner, we need a suitable location analysis tool that provides us with extensive analyses in order to ensure we make the best possible investment and location decisions. This is where the WIGeoGIS tool came into play. (...) It provides extensive information and good results quickly and easily.”
Click here to read the STIHL-Case Study.
Test WIGeoWeb for 30 days, free with no obligation. The trial period ends automatically.
Sales Controlling and Reporting
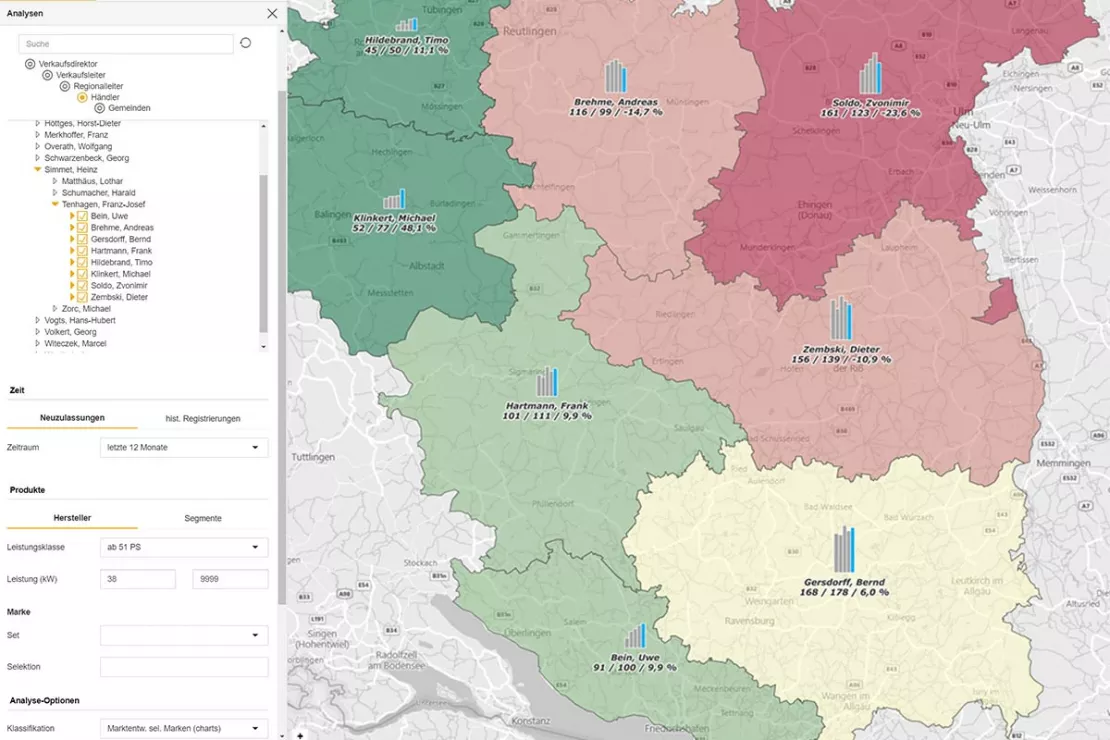
Our WebGIS tool clearly displays KPIs on digital maps. You can then click through all the important data interactively.
Clear maps, colors and charts intuitively show if you are on track to achieve your goals and success. Some companies use this as an early warning system and take quick and targeted action if a location or area is at risk of not achieving its sales targets.
In addition, you can generate reports in WIGeoWeb in the desired file format (e.g. PDF, Word, PowerPoint, Excel etc.) with a click of a button and send them by e-mail. Standard reports can also be sent automatically in regular cycles.
Our customers use individual reports for consultations with area and site managers, as well as internally as an objective basis for strategic planning and target discussions.

Interactive
analyses or individual, predefined standard reports with all the data
and key figures that are important for your business. Our WIGeoWeb
customers use the tool and the reports for business reviews, retailer
network planning and strategy discussions with retailers and sales
partners. Interactive or standardized.
Test it yourself - Market penetration analyses and sales controlling for manufacturers with WIGeoWeb
Data - The Basis of Any Analysis
Data-driven analyses can only ever be as accurate and meaningful as the data used. In addition to internal data such as sales, customer data and area data, external market data plays a crucial role.
That is why we also supply market and industry data if required. We have been working with data for decades and know the attributes, value and license models of a wide variety of data and providers. We find the data that best fits your needs and budget.
We can integrate the licensed data into WebGIS at the beginning of the project or add it later. The data can be uploaded or automatically integrated via interfaces and updated regularly.

Commercial locations, industry data, population density, purchasing power, infrastructure, and sales areas are an example of the wide variety of data that a WebGIS combines, analyzes and visualizes on digital maps. This makes our WebGIS WIGeoWeb a practical and helpful analysis tool for manufacturers.
Market and Sales Analyses - further information

Market Analysis Tool
How to successfully perform 6 different analyses. Anyone who does business, must know their market. WIGeoWeb helps to answer the question of WHERE.

Sales Territory Planning
You want to plan, evaluate and divide sales territories for your sales representatives? Here are the key reasons why geomarketing software makes sales and territory planning more efficient.

Analyze Market Penetration
With geomarketing you can find potential customers, turnover and sales! Compare your company key data with current market data on a small scale.

Demographic Data You Need
The range of Demographics available is large and varied. We have an overview and will help you make the right selection. To make sure you get the best, and at the best price.
WIGeoWeb: Fill out the form, test it free of charge & without obligation!
- Non-binding, free test for 30 days
- Test ends automatically without cancellation
- An employee will explain the tool in a short webinar*
* Information about the free test access: Standard regions with selected data in Germany or Austria will be made available. In Germany, these regions are districts in Munich and environs, and districts of Vienna and environs in Austria. The products of WIGeoGIS are intended for companies and are not suitable for private use. If you need a one-time market analysis, we will gladly make you a service offer.
FAQ
-
Can WebGIS software be connected to existing ERP or CRM systems?
Yes! WebGIS and map solutions from WIGeoGIS are connected to common ERP and CRM systems. This makes daily analyses possible without complex import procedures. Thus, every user always has access to the most current, relevant information.
-
How can geomarketing reports help me in my daily work?
Displaying internal and external data on maps allows you to recognize spatial relationships in your market areas. The information they provide serves as the basis for operational decisions and the strategic orientation of your company, for example by identifying areas with strong potential.
-
Can reports for different geographical levels and users be created simply with the push of a button?
Yes. Automated reports taking your company’s internal sales structures into account can be generated based on company performance indicators for every level and structure (regional, national and international). This is possible with existing extensions for WIGeoWeb.
-
How can I display my KPIs clearly?
The spatial representation of KPIs (Key Performance Indicators) provides you with a new perspective of your business. At a glance, you can see in what regions your customer inquiries are growing or shrinking. This allows you to quickly take countermeasures and identify weak points in sales and marketing.
Join leading companies and choose WIGeoWeb: Try it free for 30 days – risk-free, with full access to all market analysis and sales control features!

