An overview of the most practical WIGeoWeb features
With WIGeoWeb, the WebGIS for geomarketing, you can analyse and visualise data on interactive maps, understand the results intuitively and create market reports at the touch of a button. Find out here what other practical features the WebGIS offers.
With the practical functions of the WIGeoWeb WebGIS for your everyday analysis:
- you can achieve your goals even faster,
- work flexibly and
- have a complete overview of your data.
WIGeoWeb Highlights in Use
This video will show you how to use the new features of WIGeoWeb.
Test WIGeoWeb for 30 days, free with no obligation. The trial period ends automatically.
Visualisation and Quick Access to Information

Info Button – All the Relevant Information with a Single Click
Clicking on the magnifying glass with the question mark will provide you with all the data relevant for each of your queries in a window next to the map. The CMS can control which information is displayed here.
EXAMPLE: You are a regional manager and would like to see all the important market data for a municipality in your region. With a click, WIGeoWeb shows you age, population density, household size and all the other attributes that have been set in the CMS.

Bookmark Feature – Save Your Favorite Analyses
With the bookmark feature, you can save analyses and map views that you need and use frequently. You can open the saved maps by clicking on the star. This feature is also useful if you frequently do analyses in a specific region.
EXAMPLE: You would like to keep an eye on important locations or areas over time and present the development in a review discussion.
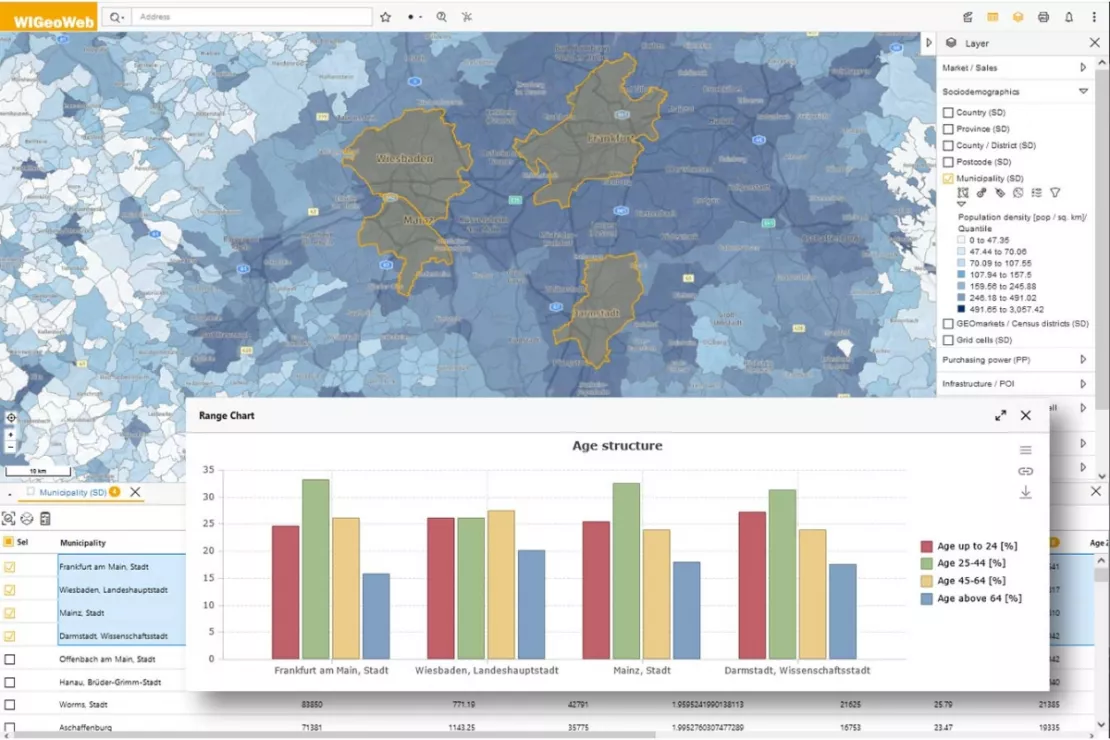
Compare age structures – Here you see Frankfurt, Wiesbaden, Mainz and Darmstadt in comparison.
Chart Tool: The Ideal Benchmark Visualization for KPIs and Market Data
You can see everything on a map, except a comparison of several features at once. That is why we have added the new chart tool that allows you to display different data using bars, lines, pie charts, etc. Give your diagrams context and visualize relationships. The new feature allows you to not only make comparisons, but also to see developments over time.
EXAMPLES of use cases for the Chart Tool:
- Comparing age groups in specific regions
- Viewing growth over time, such as population, new customers, sales development, etc.
- Comparing sales territories and their performance
- Setting sales targets in relation to market volume
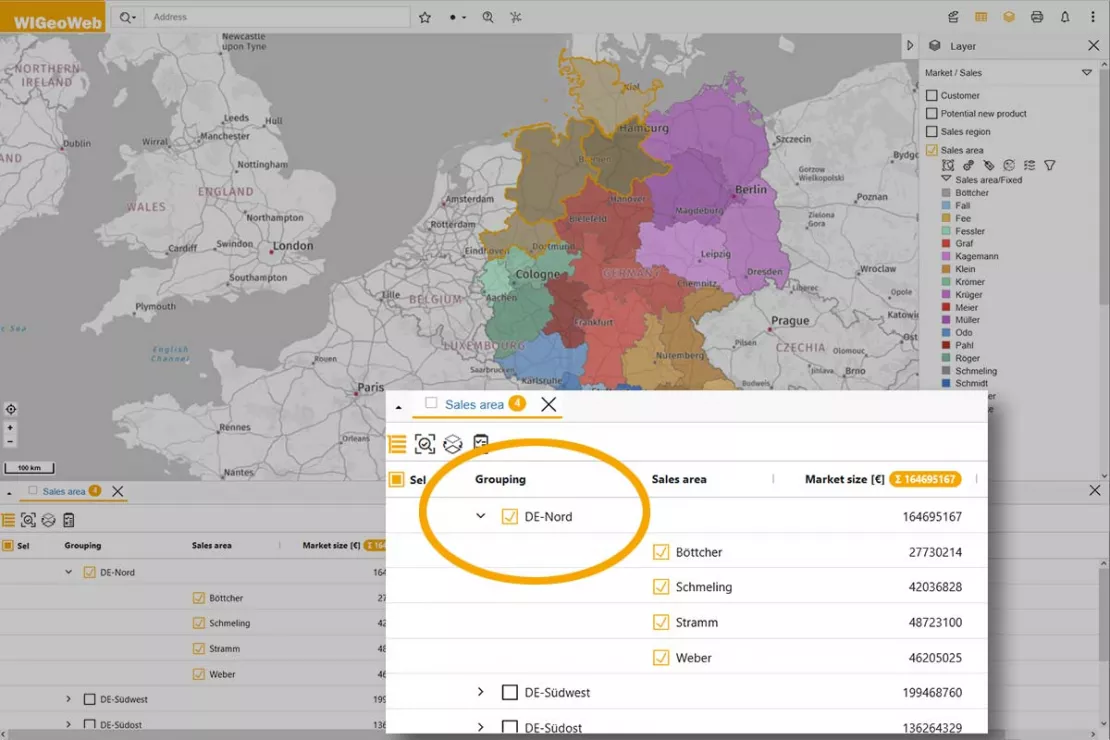
Grouping makes corporate structures visible. Here you can see the sales region for northern Germany and the associated sales areas.
Group Data Tables: For a Quicker Overview
With the grouping feature, you can optimally visualize hierarchical, geographical and organizational structures. You will quickly gain a clear understanding of the data and better recognize relationships. This makes this feature particularly helpful for sales territory and retail network planning.
EXAMPLES: This feature allows you to...
- Group sales areas & structures by region
- Group by location type or customer type
- Group geographically
- Understand how data sets are related to clusters
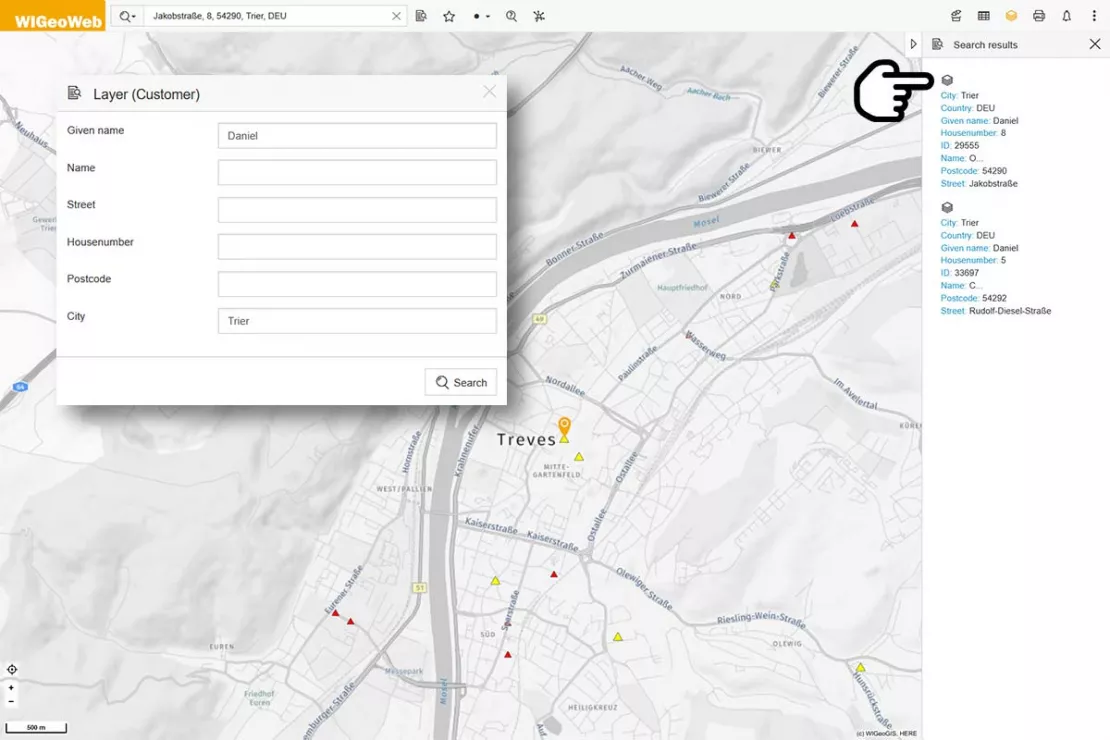
Don't just search for addresses, use the new search function to search all the data in your WebGIS.
Advanced Search - For Instant Insight
With the advanced search you can quickly search your WIGeoWeb data sets for specific information.
This is helpful for specific inquiries and questions.
EXAMPLE: A customer calls your customer service because they have a problem with a product. Your employee on the phone searches the database for the customer's name and location, for example, can view their data (ABC customer? Products purchased? etc.) and can directly identify a suitable contact person.
Test all the WIGeoWeb functions for free with no obligation. The trial period ends automatically.
Data Selection

Attribute Selection
WIGeoWeb also offers attribute selection methods. This feature allows you to select all the data records that match your query based on the available attributes. You can then start further analysis steps with the selected objects.
EXAMPLE: You would like to see the purchasing power data in all the ZIP Code areas in Bavaria with a large number of inhabitants. Simply select the areas with high population numbers in WIGeoWeb and create a report for these areas.

Multiselect Feature
The selection tools have been optimized: If you have already selected objects in the map, it is now even easier to add further objects to this selection or remove them from the selection using the map. The selected objects are highlighted on the map and in the data table and you can use them as a starting point for various analyses, for example download, reports or editing.
EXAMPLE: You looked at the organic purchasing power in Freiburg. Now you would like to know about the organic purchasing power in Villingen-Schwennigen, Mulhouse and Basel and compare them. Simply click on the areas and add them to your analysis.
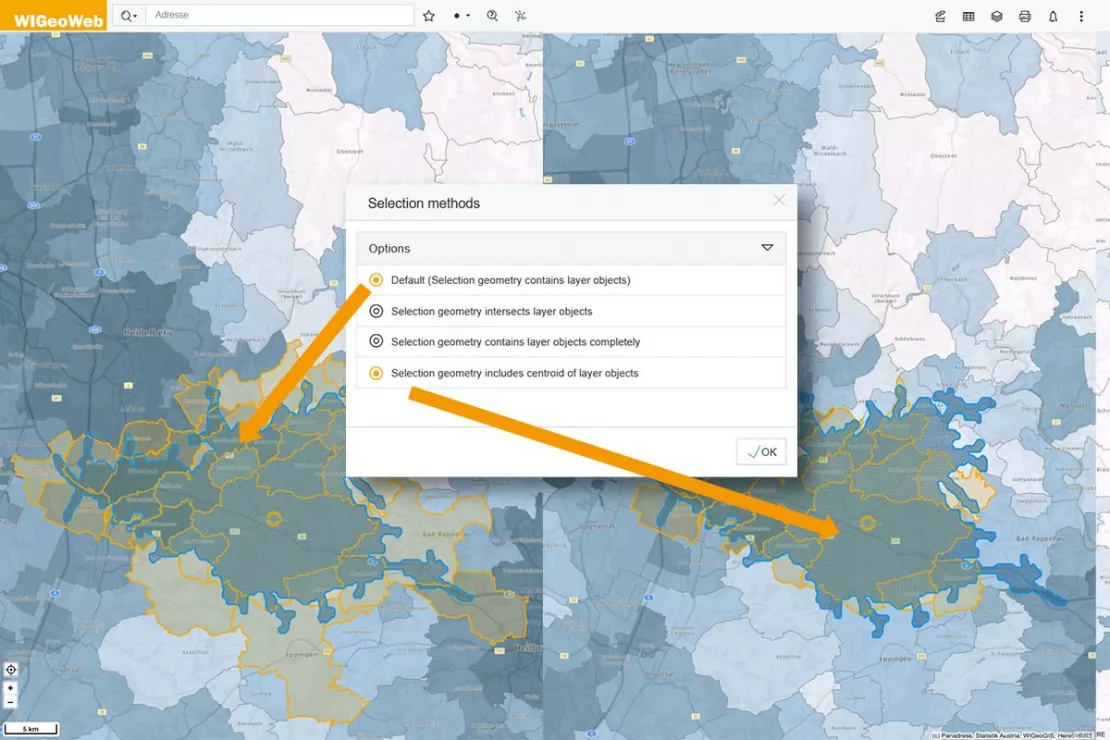
New: Four different options are now available when making a location-based selection. Here you can see two different selection methods.
Multiple Selection Methods: For More Flexibility
You can now choose between different selection methods:
- Selection geometry contains layer objects (default)
- Intersects layer objects
- Contains layer objects completely
- Centroid of layer objects
EXAMPLE: You have calculated a catchment area and now want to select the ZIP Code areas, but only those that are centrally located in the catchment area. Then use "Centroid of layer objects" for the selection. The selection on the map then looks like the screenshot on the right.
Test WIGeoWeb for free. The WebGIS software is fully functional.
Automation

Automated Data Processing
Click on the gear icon to start data processing tasks. All processing is done via the Python-based standard interface WIGeoETL and can be flexibly adapted to your specific needs.
EXAMPLE: Different data about your locations is regularly expanded, e.g. sales figures, customer surveys, bestsellers. Thanks to the automated data processing, this data always arrives correctly (no transmission errors) and promptly in the WebGIS and is available for analysis.
Test WIGeoWeb for 30 days, free with no obligation. The trial period ends automatically.
Data Extension
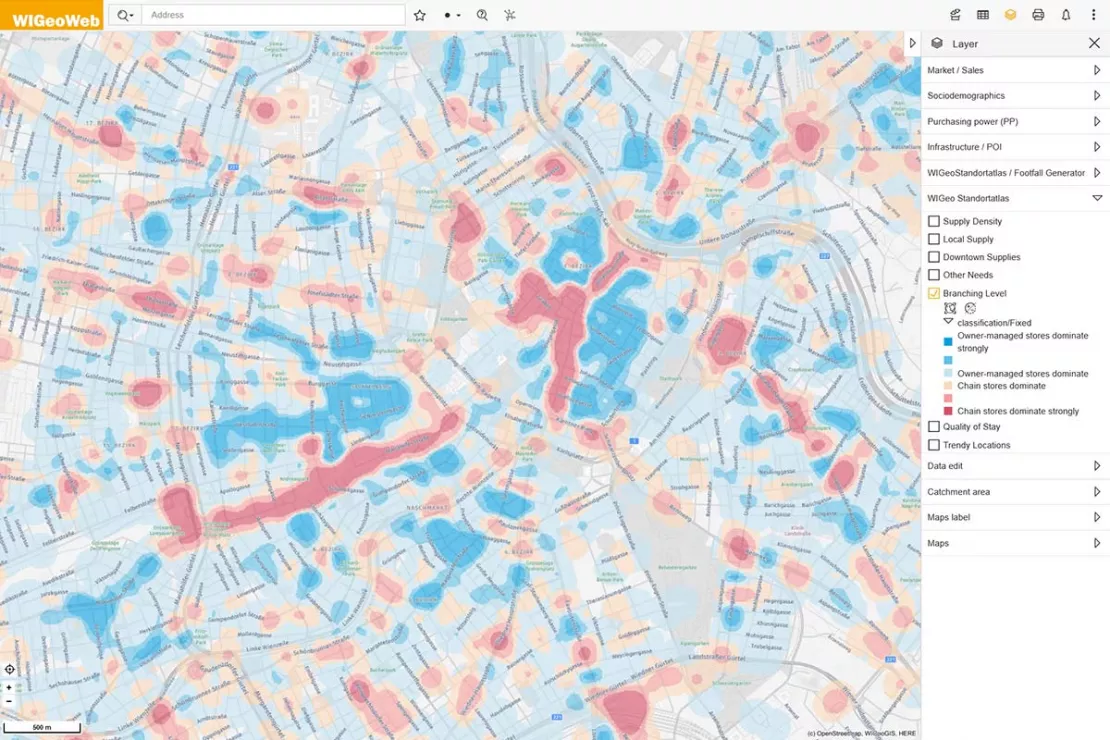
WIGeo Location Atlas provides unique and detailed location data from the entire D-A-CH region. Heat map of retail chains: here you see where there are more owner-managed businesses (in blue), and more chain stores (in red).
Data from the WIGeo Location Atlas: For Unique Location Knowledge
This one should be of particular interest for retail chains and real estate specialists. The WIGeo Location Atlas provides location factors and information about locations like no other database. For an additional charge, the data from WIGeo Location Atlas can be integrated into WIGeoWeb.
EXAMPLE: With the WIGeo Location Atlas you can answer questions such as:
- Where can I find an area with luxury brands in Vienna? With creative, alternative products? In a budget-friendly segment?
- How are the local supply hotspots distributed in Kiel?
- Where is large-scale retail located in Bern?
WIGeoWeb Not Only Makes Your Business Better, but Also Faster
With the WebGIS WIGeoWeb, you can analyze your markets and visualize your data on an interactive map clearly, intuitively and easily. You understand your business better and can act faster. The new functions give your analyses additional momentum.
Get to know WIGeoWeb WebGIS better!

WIGeoWeb: WebGIS for Geomarketing
WIGeoWeb is your online GIS for business analysis. Interactive maps. Visualize data. Simple. Intuitive. The WebGIS for your company.

Automate Your Geomarketing Analyses with WebGIS-Tasks
With the Taskbox, you can automate analyses – preconfigured, efficient, and using proven geo-methods. WebGIS-Tasks are available for WIGeoLocation and WIGeoWeb!

Data upload for ad hoc analysis via WebGIS
Immediate integration of data needed for ad hoc analyses using WebGIS has been a tedious exercise to date. This is now facilitated with WIGeoWeb.

Cloud GIS - Software as a Service by WIGeoGIS
WebGIS solutions as Software as a Service (SaaS) are convenient, topical and cloud-based. The price to performance ratio is perfect!
WIGeoWeb: Fill out the form, test it free of charge & without obligation!
- Non-binding, free test for 30 days
- Test ends automatically without cancellation
- An employee will explain the tool in a short webinar*

* Information about the free test access: Standard regions with selected data in Germany or Austria will be made available. In Germany, these regions are districts in Munich and environs, and districts of Vienna and environs in Austria. The products of WIGeoGIS are intended for companies and are not suitable for private use. If you need a one-time market analysis, we will gladly make you a service offer.
FAQ
FAQ
-
What are the core features of WIGeoWeb as a WebGIS for geomarketing?
The core features of WIGeoWeb are the analysis and visualisation of internal data and market data on a digital map. WIGeoWeb offers extensive map material for the United Kingdom and global markets.
-
What data can I integrate into WIGeoWeb?
You can integrate internal data (e.g. sales territories, turnover, data from customer types, etc.) and external market data into WIGeoWeb. This can be done via upload and/or interface.
-
Are the practical WebGIS features available as standard in WebGIS?
Yes, you can use all practical features in WebGIS with the exception of the WIGeo Location Atlas data extension. You can purchase this database and have it connected for a fee.
-
How can I purchase WIGeoWeb?
You can purchase WIGeoWeb on the basis of a flexible licence model. Initial costs are incurred for the initial setup of the WebGIS system, which depend on your requirements and the scope of the project. Please contact us. We will be happy to explain the process and price structure in detail during an initial consultation, which is free of charge.