Automate Complex Geomarketing Analyses with WebGIS-Taskbox
With our Taskbox functions, you can perform complex analyses in WebGIS at the touch of a button. Be it a location assessment, market coverage, or scoring, the calculations run in the background without requiring detailed GIS know-how. With these one-click analyses, you save time and gain solid results faster than ever.
How can you automate geomarketing analyses?
Geomarketing analyses can be automated by integrating predefined analysis workflows directly into WebGIS software. With WIGeoWeb and WIGeoLocation, both geomarketing tools from WIGeoGIS, this is done via so-called tasks: You start the analysis in the software with a click; the software automatically performs all the calculation steps in the background. WIGeoGIS has summarized relevant automation via task boxes. This way you receive reliable, up-to-date results without having to intervene manually.
What is WebGIS-Taskbox?
The Taskboxes are an extension to our WebGIS software products. Each Taskbox automatically performs a specific task (analysis task).
Automate and standardize your analyses and processes!
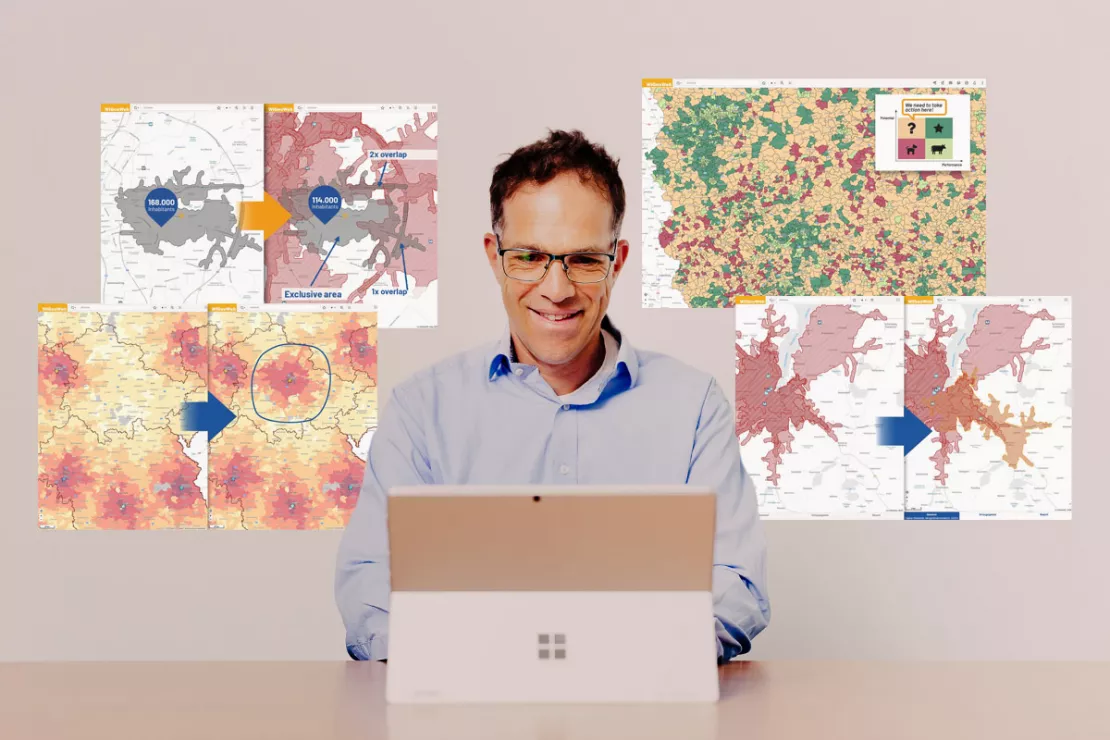
An Overview of the Key Points
- Product: Taskbox is an extension for WIGeoWeb and WIGeoLocation
- Areas of Application: Web-based geomarketing and location analyses
- Data: Individual integration of all relevant internal data and demographic data (locations, competitors, sales, population, purchasing power, etc.)
- Region: International use
- Operation: Hosting or on-premise (operation on your computers)
- Your Benefits: WebGIS-Taskboxes integrate intelligent analysis processes directly into WIGeoWeb and WIGeoLocation, all preconfigured, automated, and efficient. They serve to automate your analytics and business processes.
Which processes does Taskbox automate?
Taskbox can automate the following steps for the WebGIS software from WIGeoGIS:
WIGeoLocation, Software for Location Analysis
- Automated catchment area calculations when changing locations
- Cannibalization using overlay analysis
- Sales forecasts using gravity analysis
WIGeoWeb, Software for Market Analysis and Geomarketing
- Calculating market coverage & identifying white spots
- Distance matrices and visualization of customer/retailer relationships
- Scoring analysis
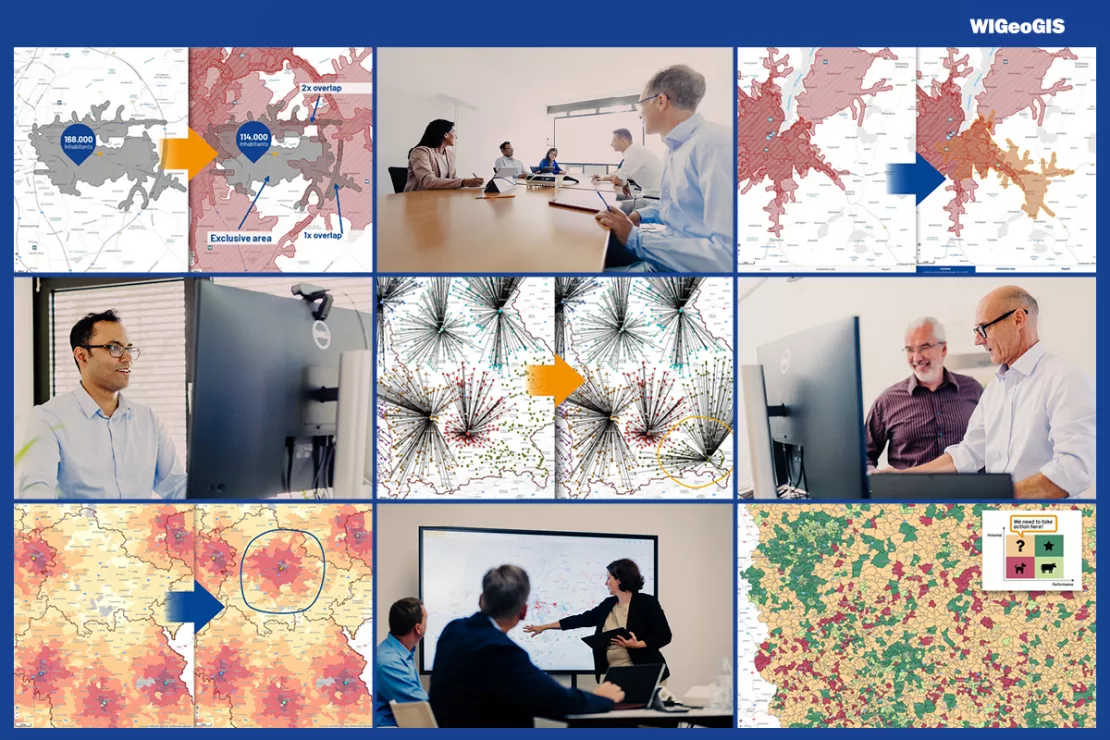
WebGIS-Taskboxes allow you to automate and accelerate business processes across your entire company Thanks to a roles-rights concept, different departments can be given targeted access to the tasks relevant to them in the WebGIS software.
WebGIS-Taskboxes in Detail: Here you will learn about...
The Benefits of Analysis Automation with WebGIS-Taskbox
WebGIS-Taskbox allows you to perform analyses more quickly, easily and precisely. This is possible because the tasks allow you to standardize and automate important, complex workflows that would otherwise have to be performed manually, which is very time-consuming. Automating these workflows also eliminate errors. This in turn ensures the analysis results are perfectly comparable because the analyses are carried out identically. Multiple tasks for different user groups can also be integrated into one application.
Your Benefits at a Glance
- Automated analyses at the push of a button (one-click analyses)
- Workflows with ideal geomarketing methods and your individual adjustments
- Multiple automation processes in one application
- No GIS expertise required
- Each task is individually customized and activated
- Calculations run in the background, saving time
Automate and accelerate your business processes with Taskbox! Request a live demo now.
Automation for location analysis with WIGeoLocation
Taskbox can perform the following tasks in the location analysis software WIGeoLocation:
- Automated catchment area calculations when changing locations
- Cannibalization using overlay analysis
- Sales forecasts using gravity analysis -> Learn more under Location Analysis and Sales Forecasts
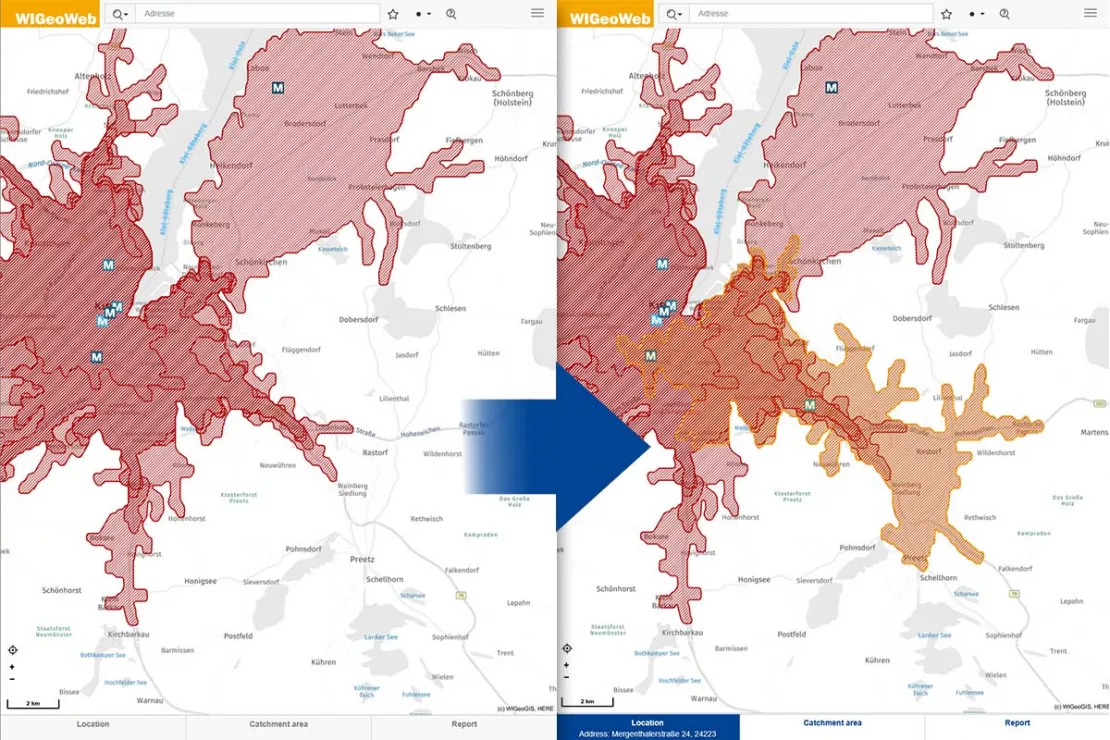
Automatic Catchment Area Calculation when Locations Change
Whether you are opening, moving, or closing a location, this WebGIS task automatically adjusts the catchment areas of your locations as soon as a location changes.
New locations automatically receive a catchment area. When moving to a new location, a new catchment area is also automatically calculated. When locations are closed, the associated polygon is automatically removed.
Examples and Processes for Catchment Area Calculation
- Closing a location: You close a location. The system automatically deletes the associated catchment area.
- Moving a location: You are moving to a new location. WebGIS-Task automatically deletes the old catchment area and calculates a new one.
- Opening a new location: You are opening a new location. The system calculates and adds a new catchment area based on your specifications.
Process automation for catchment area calculation reduces manual work and ensures that your analyses are always based on current location data and valid catchment areas.
This WebGIS task is ideal for retail, franchise and branch network planning and perfectly supports departments such as expansion planning, category management and marketing.
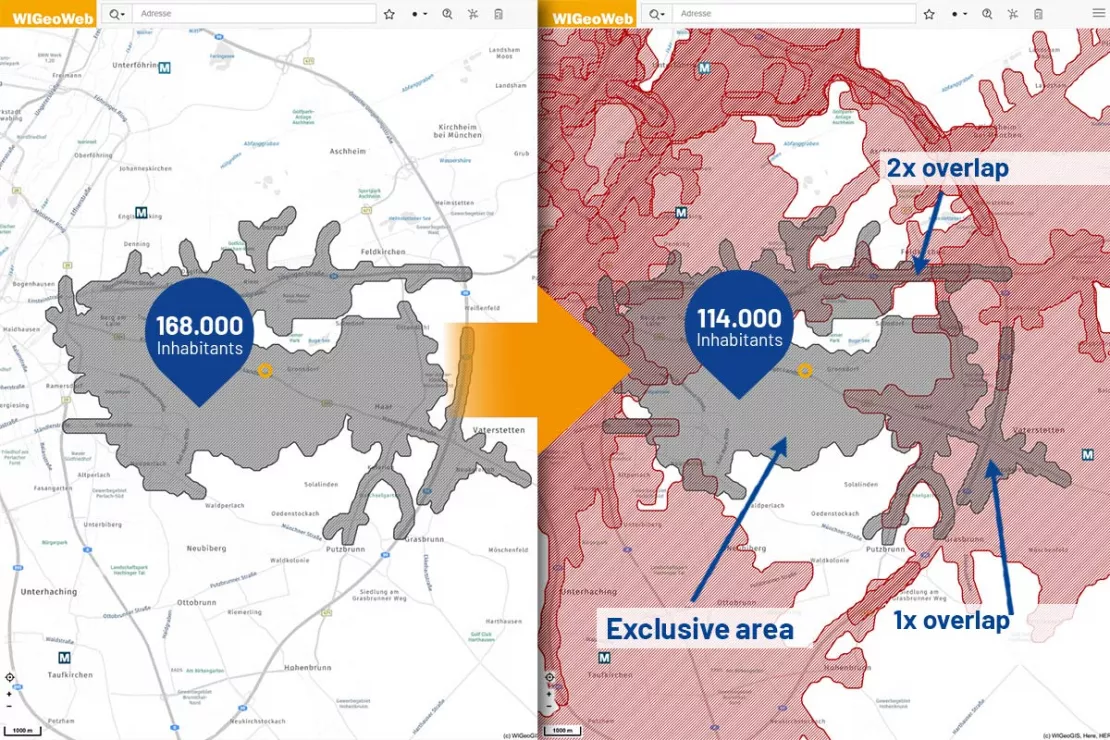
Cannibalization Analysis: Identify and Evaluate Overlays
With this WebGIS-Task, you can extend the classic location report from WIGeoLocation with a cannibalization analysis. This calculates the extent to which catchment areas of your own locations overlap and how this affects the location potential.
The more catchment areas overlap, the smaller the potential of the individual locations becomes.
Example of Cannibalization Calculation:
If two locations overlap, the relevant key figures such as industry purchasing power, residents, households, etc. are halved. If three catchment areas overlap, the key figures are divided into thirds, etc.
The cannibalization effect indicates how much sales potential a location has to share with neighboring locations With the insights from cannibalization analyses, you can avoid overestimations and make informed expansion decisions.
This WebGIS-Task is ideal for retail, franchising, and the planning and evaluation of retail and distribution networks.
Would you like to automate your location analysis and planning processes? Our Taskboxes make it possible!
Automation for market and geomarketing analyses in WIGeoWeb
Three WebGIS tasks are currently available for the market and geomarketing software WIGeoWeb:
- Calculating market coverage & identifying white spots
- Distance matrices and visualization of customer/retailer relationships
- Scoring analysis
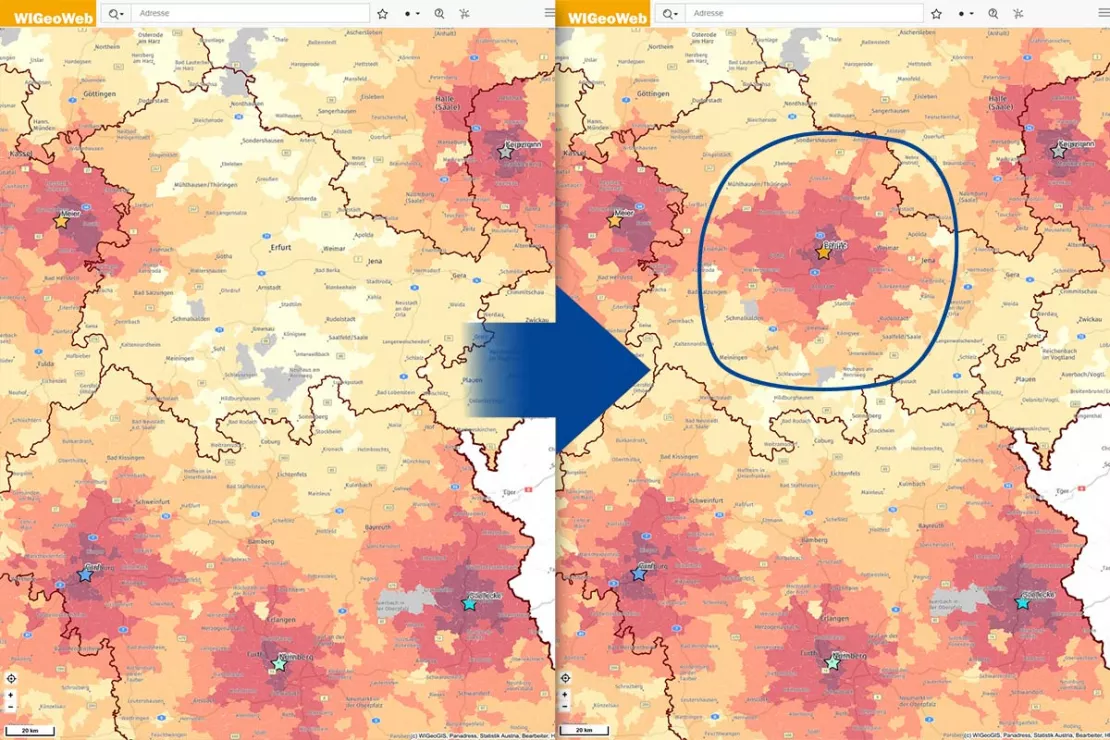
Market Coverage: ZIP Code Accurate Coverage at the Touch of a Button
This task analyzes the market coverage of your retail locations and shows which ZIP Code areas are well served based on the distance to the nearest location.
- Changes to retail locations (opening, closing, moving) are automatically taken into account in the task.
- The data is updated reliably in the background.
- This is particularly helpful for strategic territory planning, sales network development and resource management.
This WebGIS-Task is ideal for all companies with brick-and-mortar stores. Customer proximity and accessibility are important when products require intensive consultation and must be experienced physically. At the same time, the distribution network must be economical. Departments such as strategy, sales, and marketing are perfectly supported by this WebGIS-Task.
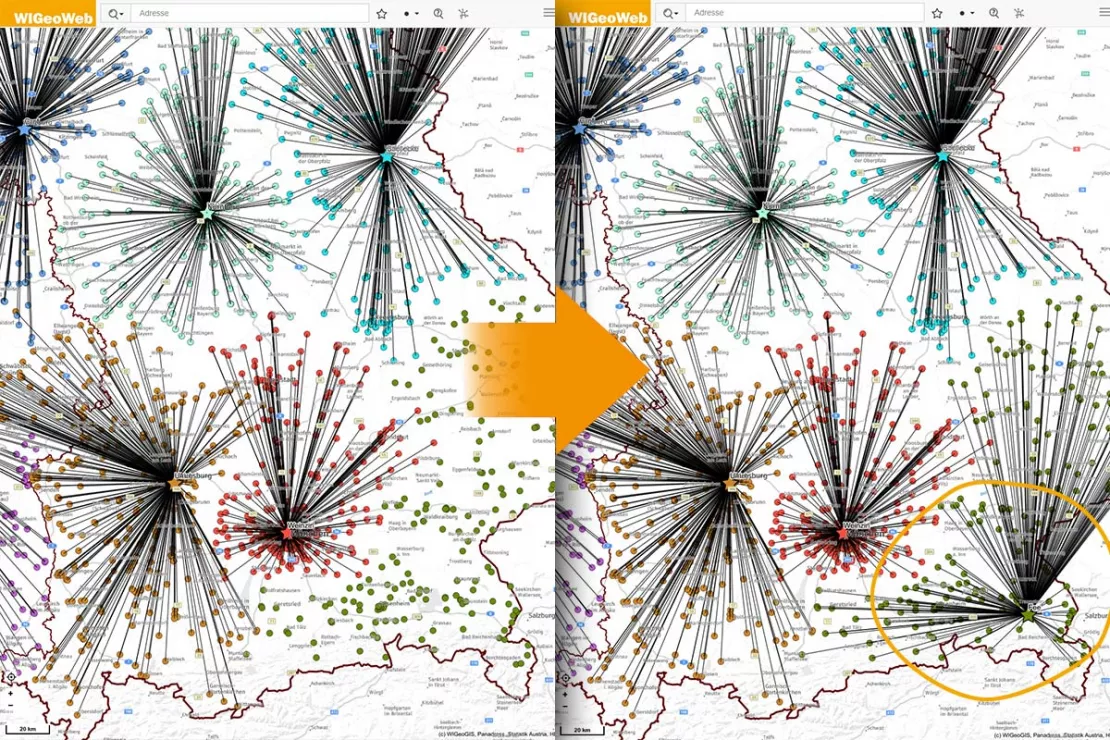
Calculate distances between retail locations and customers and visualize them as spider webs
This task calculates the real car travel times between your sales locations and customers – based on real road networks. The results (individual distances) are displayed as a network of lines (spider web).
The analysis method and visualization are ideal for sales territory planning, sales representative allocation, and customer service optimization.
Changes to customers or locations are automatically taken into account, and the data always remains up to date.
This WebGIS-Task perfectly supports companies in territory planning, network planning, and sales management.
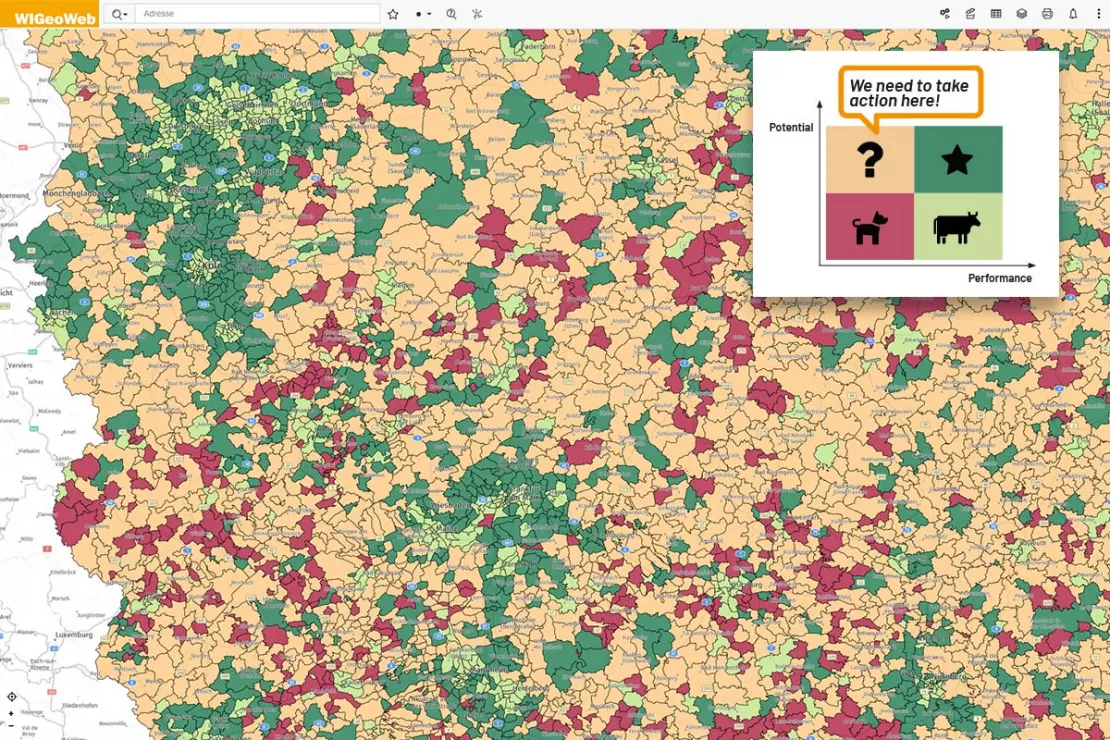
Scoring: Compare Potential and Performance
With the Scoring-Task, you can evaluate ZIP Code areas of a country based on potential and actual key figures, such as customer numbers or sales. Select the evaluation criteria, their weighting, and the method (quantiles or min/max).
This creates an individual score between 1 and 10, which is perfect for:
- Identifying potential
- Rating performance
- Targeted market development
The scoring analysis is a simple and interactive analysis that allows you to compare external figures (potential) with internal figures (performance) and thus gain a good overview of your markets and successes.
With the new WebGIS-Taskboxes from WIGeoGIS, you can automate key analysis processes and gain valuable insights without the need for additional tools, GIS expertise, or complicated solutions.
Maximum analysis quality with minimal effort!
Automate Your Geomarketing with WebGIS-Taskbox: Request a FREE Live Demo!
- FREE Live-Demo*
- Non-binding, without further obligations
- Online presentation via video call
Do you want to know more about the automation options in WebGIS? I will be glad to support you.
* The products of WIGeoGIS are intended for companies and are not suitable for private use. If you need a one-time market analysis, we will gladly make you a service offer.
FAQ
-
I already use WIGeoWeb or WIGeoLocation. How do I get WebGIS-Tasks?
The Taskbox is an extension of the aforementioned products WIGeoWeb and WIGeoLocation, so you can use the functions and workflow. Simply contact your customer representative. They will be happy to provide you with detailed information and advise you on the integration, procedures, and costs.
-
How much does WebGIS-Tasks cost?
To use one or more WebGIS-Tasks, you will need a license for WIGeoWeb or WIGeoLocation. These are the basic systems. You can book any task. The price is calculated individually for you, depending on the complexity of your requirements (e.g., external data, roles, rights).
-
Can I license just a single task?
Yes, that is possible.

