Calculate Cannibalization Rate with QGIS Plugin
WIGeoGIS allows you to calculate the cannibalization effect of locations automatically in QGIS
How much are two or more locations cannibalizing each other? How much of the sales would a new branch take away from an existing branch? What impact does this cannibalization have on the earnings of a location? The QGIS plugin from WIGeoGIS automatically calculates cannibalization effects for your strategic branch expansion.
How close is too close?
Easily Calculate Cannibalization Effects
As part of a location analysis, it is worthwhile to also evaluate the cannibalization effect. When the catchment areas of locations overlap, it can lead to cannibalization with one location taking away part of the business from another location. Customers who live or work where the catchment areas overlap have to choose one branch, which means that the other branch generates less revenue. This is particularly relevant for decisions on branch location.
A new plugin from WIGeoGIS for QGIS, the GIS software for experts, makes the analysis of cannibalization very easy. With the push of a button, this plugin allows you to find out how much customer potential locations are already taking, or in the future may take, away from each other. Calculating the cannibalization effects provides you with valuable data as a sound basis for your decision-making process, ensuring you choose the best possible location.
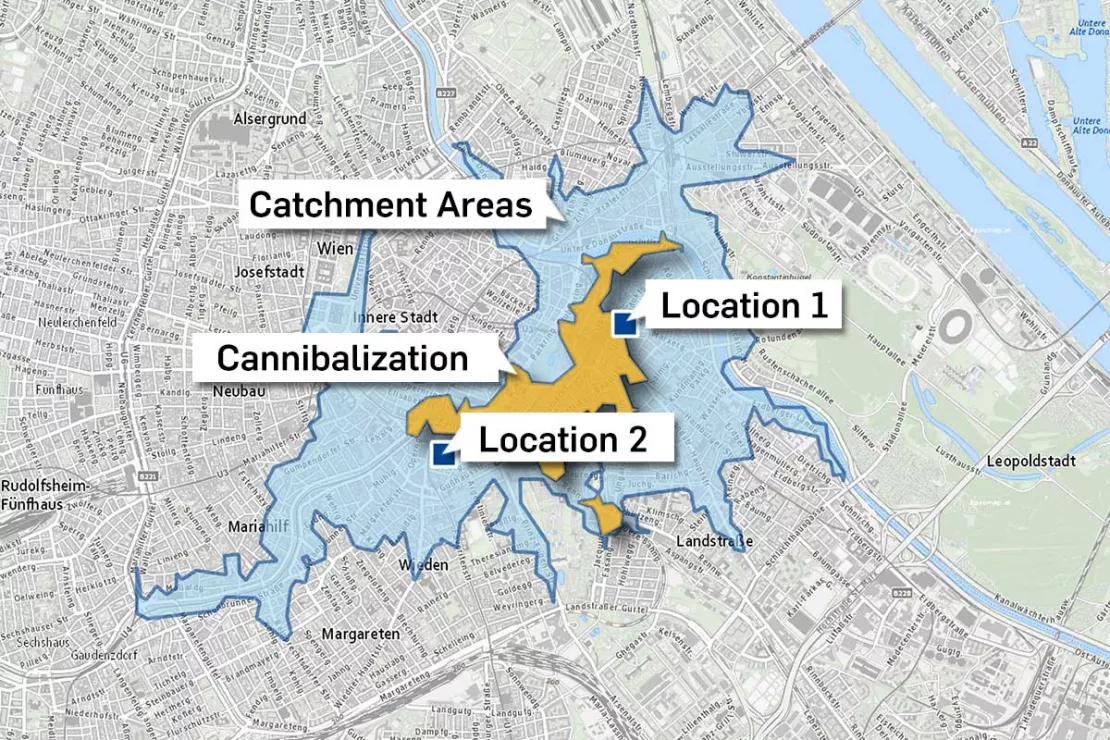
The defined catchment areas (blue) are calculated for locations 1 and 2. The QGIS plugin displays the overlapping area (orange) and specifically quantifies the cannibalization effects.
The WIGeoGIS team is happy to help you implement the software and develop your know-how or, if you prefer, we can also analyze the overlay effects and cannibalization for you in consulting projects.
Location Analyses: Calculate Cannibalization - Try the Tool for Free!
The Overlay Analysis in Action
In the following tutorial, the Head of GIS Analytics at WIGeoGIS Vienna explains how the overlay analysis using the QGIS plugin works and how cannibalization effects can be visualized:
With the overlay analysis plugin for QGIS from WIGeoGIS, questions like these can be answered automatically without tedious calculations:
- How close is too close?
- Which locations are taking customers away from each other?
- Does it make business sense to open a new location near an existing branch?
- How much revenue does an existing branch actually lose through a new location?
- Which of several free business premises is best because it cannibalizes the existing locations the least?
- How many residents live in the overlapping catchment area of two branch locations?
- How much would the expansion of one location cannibalize another location?
- Is the potential of possible new locations large enough or are they located in such a way that strong cannibalization effects would occur?
- Where are there underserved white spots where cannibalization does not occur?
- What effects does a new franchise location have on my own branch network?
- What are the effects on my branches if I also sell my own products in other stationary sales locations?
Location Analysis: Recognize Cannibalization Effects Early
Three application examples that show how you can test cannibalization effects
Analyze the potential of a new location in a municipality
There is already a bakery in one municipality, but it is a bit overcrowded. A suitable business premises is available for rent. The bakery owners have to decide whether they should turn this location into another branch. With a cannibalization analysis in QGIS, you can find out how high the potential of the new branch is and whether or how much the two branches would take away from each other in terms of sales.
Determine sales expectations for several potential new branch locations
A fashion retail chain has the option of taking over 20 branches from a competitor. If the locations of these branches are too close to their own existing locations, they would cannibalize each other. With the help of the QGIS plugin, the fashion retail chain can analyze how the new branches would affect the sales of the branch network.
Calculate the cannibalization effect of a new sales channel
A chocolate producer would like to offer its products in the branches of a supermarket chain, but also has its own branch network. The QGIS plugin from WIGeoGIS helps to evaluate how much this decision would cannibalize the business of your own branches and what potential the new sales channel would bring.
Cannibalization can play a role, for example, when planning the locations of doctors, pharmacies, bank branches, charging stations, in retail outlets, at travel agencies, tobacconists or post offices.
How does an overlay analysis work in QGIS?
This is What Responsible Managers Say about Cannibalization Analysis
“The WIGeoGIS software makes cannibalization visible and enables us to see which locations are deprived of how much revenue in the event of a branch expansion. The proven method of overlay analysis has been used for a long time in location analyses, and is now also available as an automated analysis in QGIS.”
Kai Barenscher, Senior Consultant WIGeoGIS
“We explain to you how simple or complex overlay analyses work in QGIS and how analyzing cannibalization effects can help you make the best possible location decisions.”
Andreas Marth, Team Leader GIS Services WIGeoGIS Austria
QGIS Software and methods - further information
QGIS Plugin for Geomarketing
The WIGeo QGIS plugin expands the QGIS software with numerous functions that make location analyses, target group analyses and market analyses easier for you.
What are the advantages of QGIS software?
QGIS is the basis for geo-analytics on desktop systems. With a wide range of functions, open source software is the right choice for numerous applications.
Geocode Plugin for QGIS - Simple, Fast, Flexible
Geocoding in QGIS with our plugin! Process, check and correct worldwide addresses. Request our geocode plugin, select the number of geocoding credits you want and get started.
Location Analysis in Retail
Location analysis is still crucial in retail. We offer the know-how and the tools to ensure you make successful decisions for your business locations.
QGIS Software: Request a FREE Live Demo!
- FREE Live-Demo of QGIS Software
- Non-binding, without further obligations
- Online presentation* via video call
Do you want to know more about QGIS software? I will be glad to support you.
* The products of WIGeoGIS are intended for companies and are not suitable for private use. If you need a one-time market analysis, we will gladly make you a service offer.

