
WIGeoWeb 5.3: Highlights of the New WebGIS Release
WIGeoWeb 5.3 Offers Powerful Geoanalysis Features.
Public transport catchment areas, potential-based catchment areas, and AI-powered location reports are just three highlights that make your analyses even better. Discover the new features of WIGeoWeb 5.3.
What is WIGeoWeb 5.3
WIGeoWeb 5.3 is the latest version of the powerful and proven WebGIS software for geomarketing. WIGeoWeb offers many new features that make your analyses faster and better.
Highlights of WIGeoWeb 5.3 at a Glance:
- Calculate catchment areas based on public transport, travel by bicycle/e-bike/scooter, or potential
- Location analysis with Google Gemini AI integration
- Point Stacker: Visualize large amounts of data and identify patterns faster (How much is where?)
- Highlighting makes the table easier to use
- Intuitive filters for market and geodata
I would like to try all the new features of WIGeoWeb 5.3 myself!
WIGeoWeb 5.3 Features in Detail
- Enhanced Catchment Area Calculation
- AI Integration: Supplementary Reports with Gemini
- Point Stacker: Visualize Large Point Sets and Identify Patterns Faster
- Optimized Data Table: Selections Highlighted in Color and Easily Cleared with the Escape Key
- Filter Geodata Spatially More Efficiently
- Try WIGeoWeb 5.3 for free
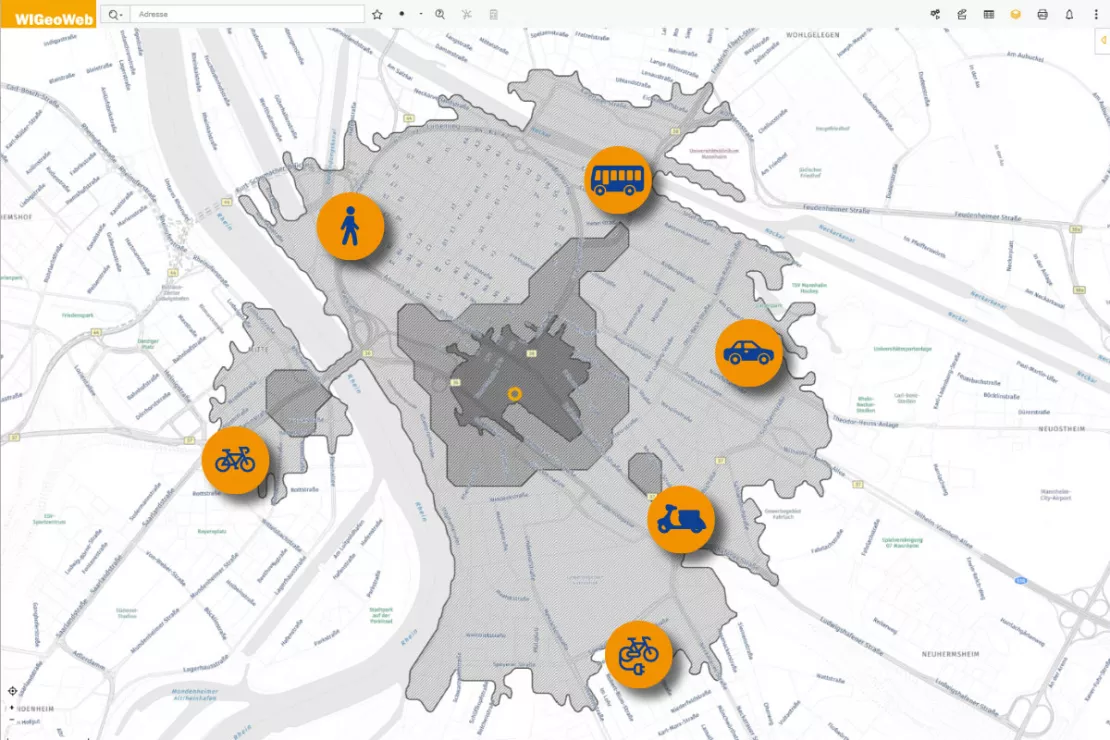
Enhanced Catchment Area Calculation
In WIGeoWeb 5.3, catchment area calculation has been expanded with three new methods. In addition to the established options for walking, driving, and straight-line distance, public transport and two-wheeled modes of transport—bicycles, e-bikes, and scooters—are now available. You can even select a specific travel speed for each of the two-wheeled options.
A particularly valuable new feature is catchment area calculation based on potential metrics. These can include the number of customers, sales, population, and much more.
Examples of Using the Enhanced Catchment Area Calculation:
- A retailer wants to know how many residents can reach their new location within 30 minutes by public transport.
- A delivery service wants to realistically map their delivery area in Munich. Deliveries are made by e-bike at 20 km/h.
- A franchisor wants to plan their territories based not on travel time but on customer potential, for example, 50,000 households.
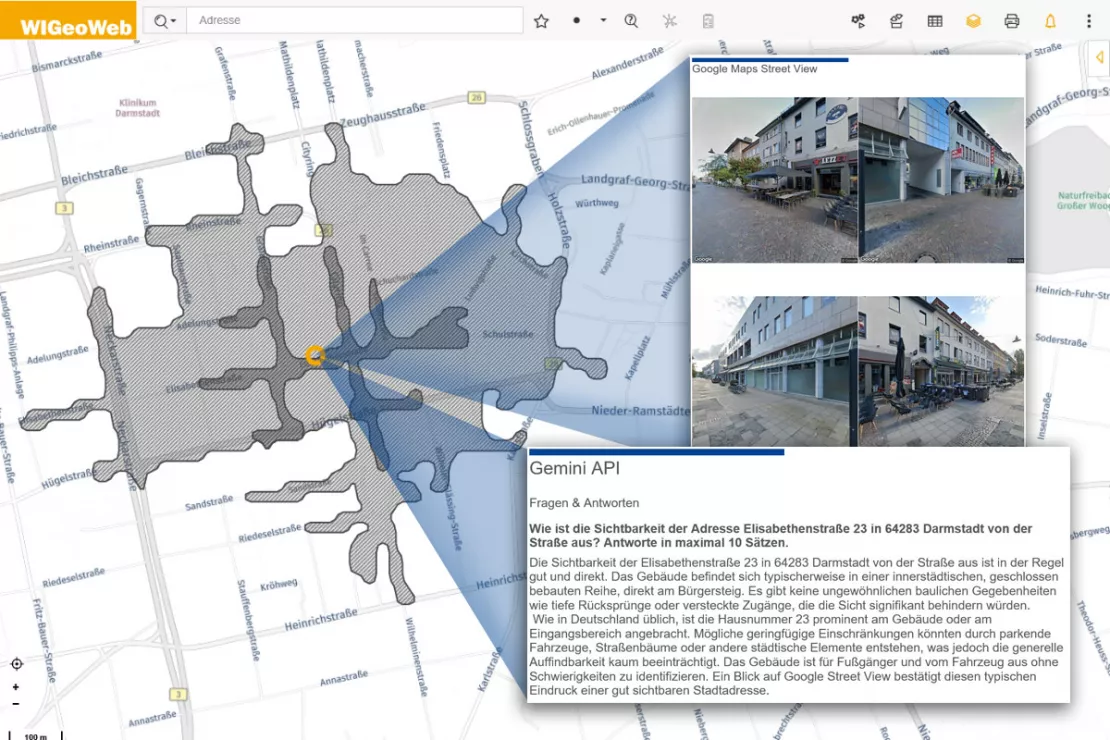
AI Integration: Supplementary Reports with Gemini
WIGeoWeb 5.3 integrates Google Gemini directly into the analysis workflow. You ask location-specific questions, and WIGeoWeb automatically passes the geographic context to Gemini and provides structured, AI-generated supplementary information for your location reports. Google Street View images in the report make the location visible.
WIGeoWeb provides the geographic context, be it an address, district, coordinates, or catchment area. You define your standard questions, and we enter the optimized prompt in the WebGIS so you only need to select from predefined options. You can, of course, also enter your own prompts.
Examples of AI-Generated Location Reports
- Question about the opportunities and risks of a location: Gemini provides structured information on the strengths and weaknesses of the macro-location.
- Question about parking availability on a particular street: Gemini analyzes Google Street View and provides a precise assessment.
- Question about storefront window area and footfall: WIGeoWeb passes the location context to Gemini, which evaluates the available data.
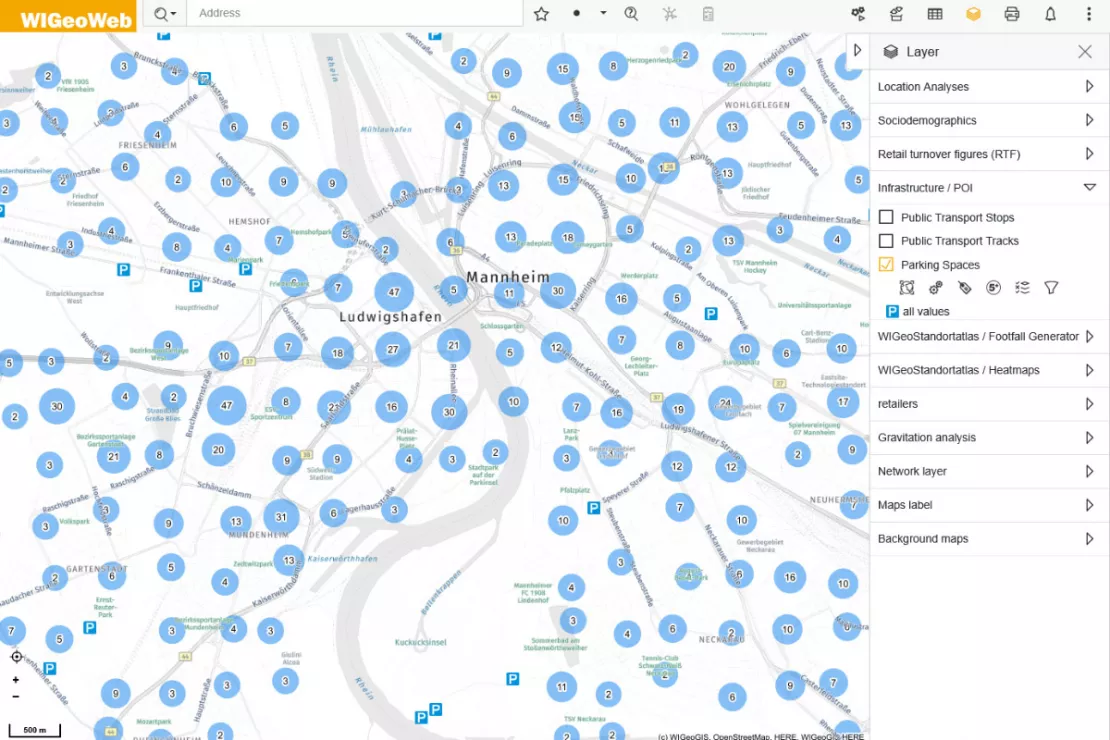
Point Stacker: Visualize Large Point Sets and Identify Patterns Faster
How much is where? The Point Stacker provides a faster and clearer way to display large numbers of points on the map. Instead of loading and displaying thousands of individual points at once, the Point Stacker automatically groups data points by zoom level and shows how many records each circle represents.
The size of the circle varies depending on the number of points, making patterns easier and faster to identify.
Benefits of Point Stacker
- Spatial analyses become easier because large volumes of data are aggregated.
- Easy to read: the number of overlapping points is displayed.
- White spots and high-performing areas become visible and easy for everyone to understand.
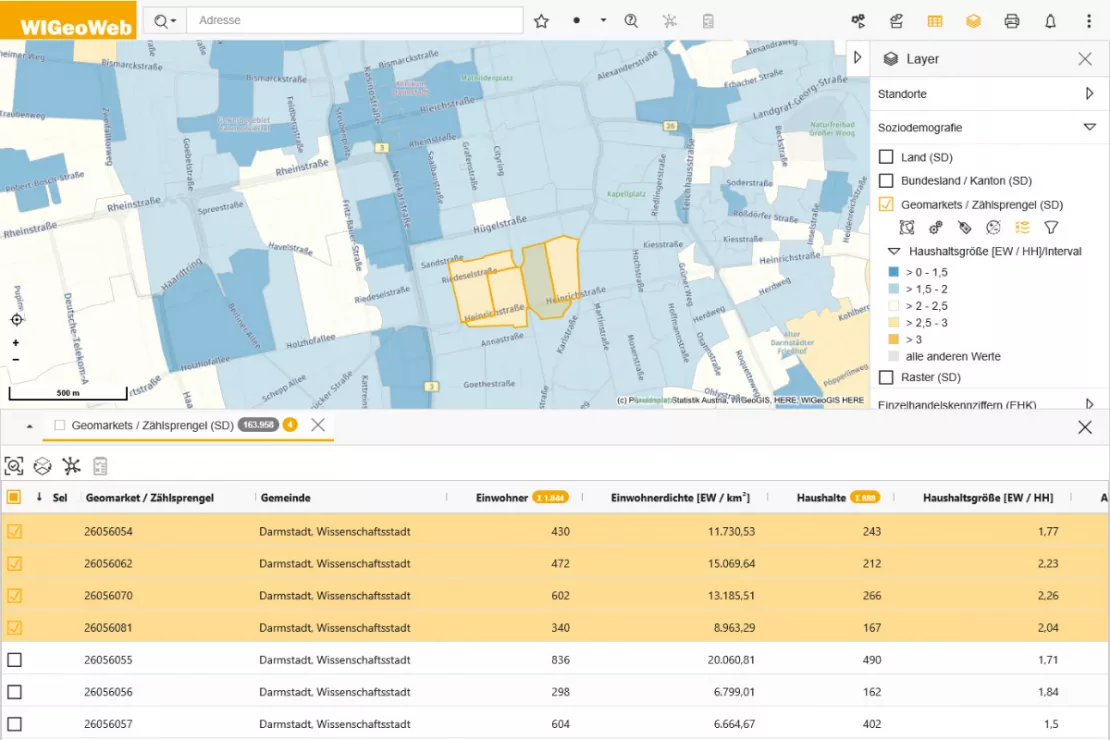
Optimized Data Table: Selections Highlighted in Color and Easily Cleared with the Escape Key
Selected data is highlighted in orange throughout the table. This makes selected records easier to identify and helps you maintain an overview even when working with large datasets.
Another advantage: the table shows both the total number of records and the number currently selected. Press the Escape key to clear a selection.
Would you like to try all the highlights of WIGeoWeb 5.3 for yourself?
Filter Geodata Spatially More Efficiently
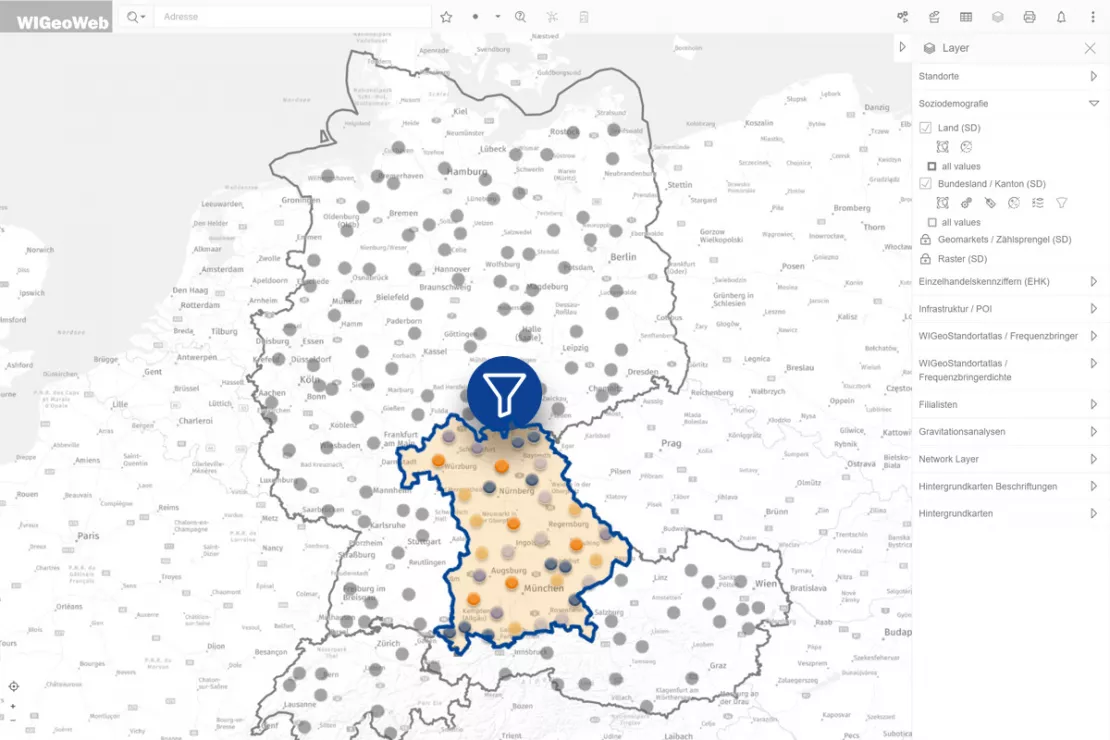
Hierarchical filters: When you select a hierarchy level (e.g. sales region, product group, customer group, federal state, etc.), the subordinate filters automatically display only matching options. This makes your work even faster and more precise.
Improved usability: With WIGeoWeb 5.3, you can set filters without activating the dataset. The system then loads only the filtered geodata, making it more user-friendly when working with large datasets.
WIGeoWeb 5.3: More Speed, More Intelligence, More Clarity
With WIGeoWeb 5.3, you can analyze your markets more comprehensively and precisely than ever before. The new features make the WebGIS application even more powerful. The enhancements can be used across industries and benefit all WIGeoWeb users.
Try WIGeoWeb 5.3 for Free with No Obligation. The Trial Ends Automatically.
WIGeoWeb 5.3: Fill out the form, test it free of charge & without obligation!
- Non-binding, free test for 30 days
- Test ends automatically without cancellation
- An employee will explain the tool in a short webinar*

* Information about the free test access: Standard regions with selected data in Germany or Austria will be made available. In Germany, these regions are districts in Munich and environs, and districts of Vienna and environs in Austria. The products of WIGeoGIS are intended for companies and are not suitable for private use. If you need a one-time market analysis, we will gladly make you a service offer.
FAQ
-
Which industries are the new features in WIGeoWeb 5.3 suitable for?
The new features can be used across industries. WIGeoWeb is suitable for all companies and organizations that plan, analyze, and organize locations, territories, and markets, from retail and real estate to franchise systems, industry, and the public sector.
-
Are public transport catchment areas and the Gemini integration included in the standard version of WIGeoWeb?
Public transport catchment areas and the Gemini AI integration are optional modules available for a small additional charge. All the other new features - Point Stacker, the optimized data table, and improved filtering - are included in WIGeoWeb.
-
How can I make the best use of the Gemini feature?
We discuss standard questions with you in advance and configure suitable prompts for your typical use cases. This means your users do not need to formulate their own prompts; they simply select from predefined questions. The option to enter your own prompts is still available.
-
How secure is my data with the Gemini integration?
No customer-specific data is passed to Gemini. Only prompts relating to publicly available data (e.g. images from Google Street View and data from Google Maps) are sent. WIGeoGIS is identified as the sender for every prompt. In addition, because WIGeoGIS uses the commercial version, no prompts or requests are used to train Gemini.
-
How can WIGeoWeb be used?
All you need to use WIGeoWeb is a browser. WIGeoWeb is a WebGIS hosted on servers in Europe. The software therefore fully meets the requirements of the GDPR and can also be operated within your company or your cloud environment.
The optional Gemini module is an exception: organizations that want to use AI-powered location reports purchase this add-on separately. Location-specific queries are then sent to Google Gemini. For organizations with very strict data protection requirements, we recommend reviewing this in advance.