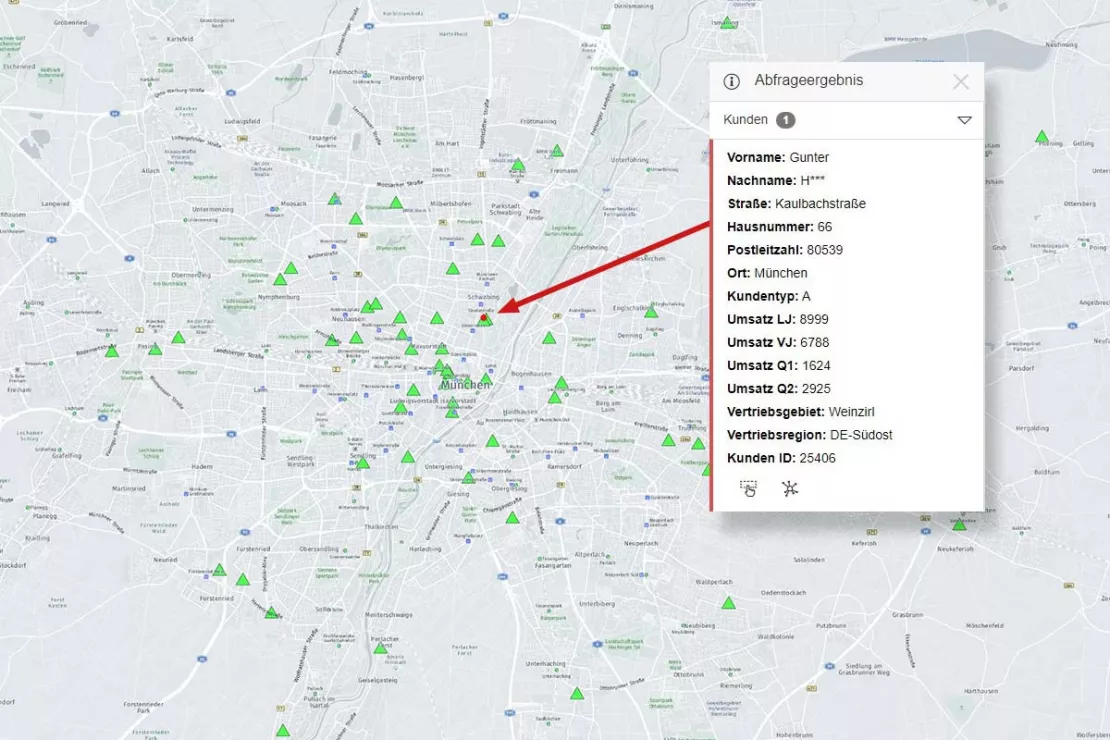
Customers on a Map
With the WIGeoWeb tool, you can display your customers on a map and analyze your customer data down to the last detail.
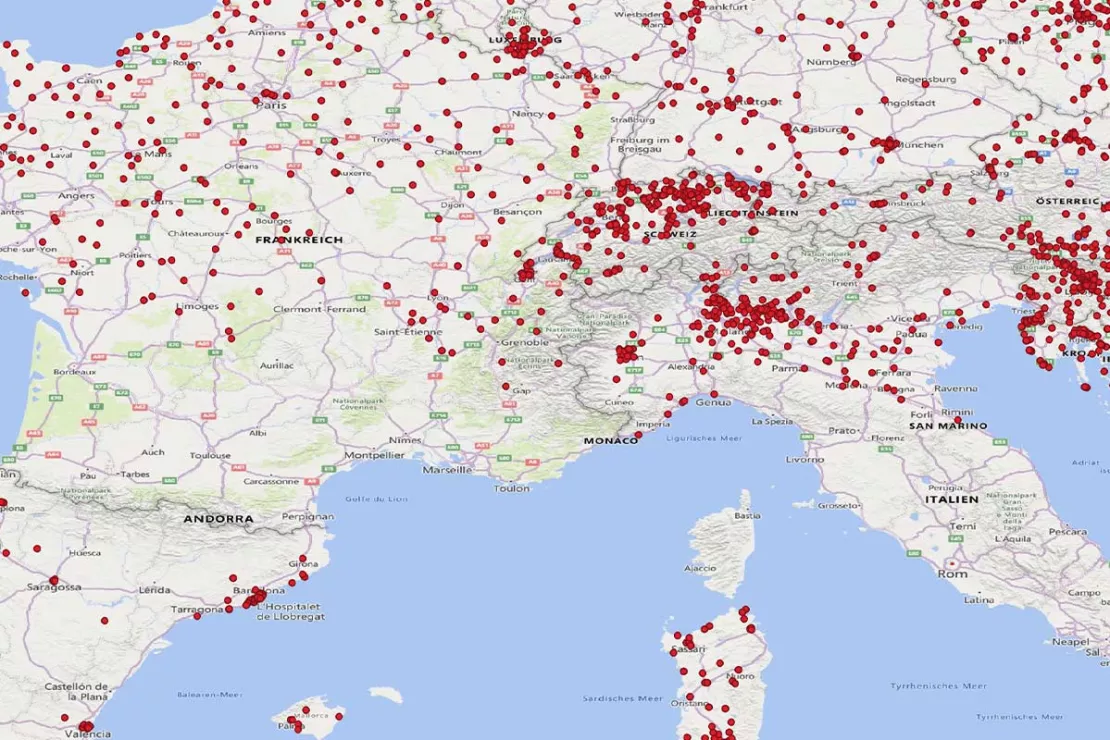
Customer Map Tool: Benefits at a Glance
- Easily display all your customer addresses on a digital map
- Quickly recognize patterns at a glance (distribution in space, clusters, “white spots”)
- Always available as an online tool, quick & easy to implement without a large IT project
- Allows sales, distribution and marketing teams to work collaboratively
- High data security and GDPR compliant
Can I Display Customers on a Map? Of Course! Request your WIGeoWeb test account now for free with no obligation.
Customers, Locations, Addresses – We Put All the Data You Want to See on a Map
Be it your company locations, customer addresses, competitor locations or infrastructure, our WIGeoWeb software can display everything with an address on a digital map. With our tool, you can set your pins digitally in the future and see your data on the map.
This is possible because our tool integrates a so-called geocoder that converts every address into an X/Y coordinate. Using this coordinate, any address worldwide can be located and displayed on a digital map. The geocoding process runs automatically in the background. As a result, you will see your address data as dots, pins or, if you wish, as another symbol on the digital map.
You can visualize 400 customer or location addresses on a map for free with no obligation! The free trial period ends automatically after 4 weeks.
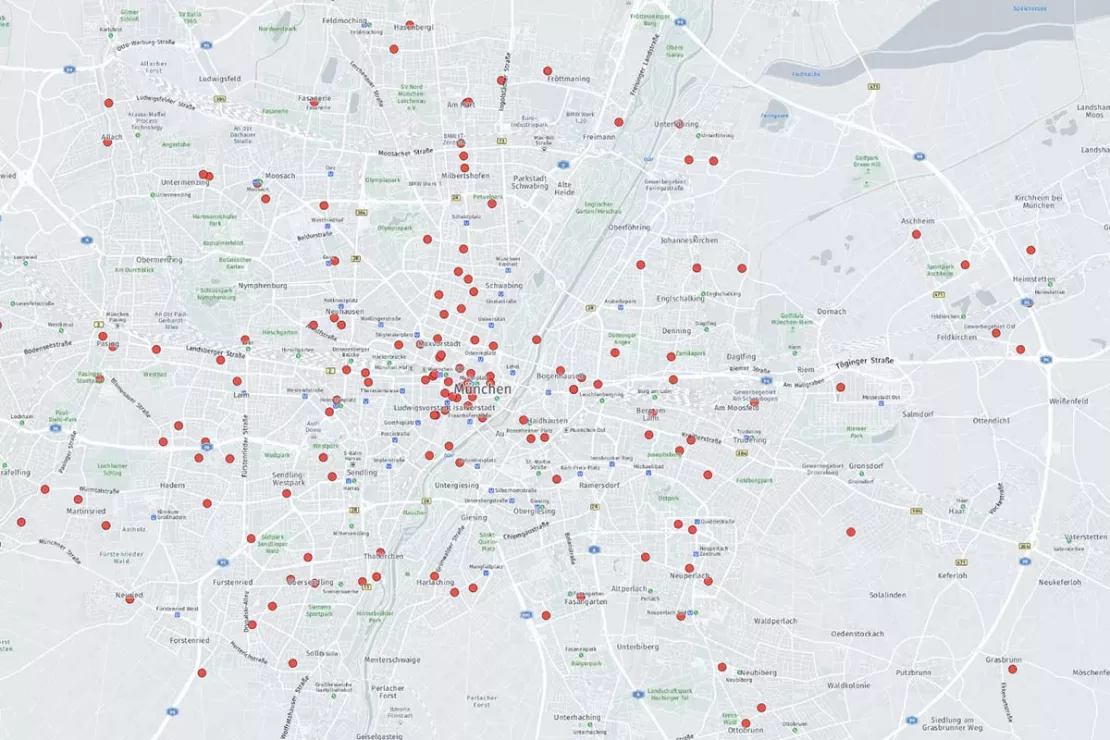
Show Customers as Points on a Map
All your customers at a glance on a map. With WIGeoWeb, you can identify your customers as points (pins) on the map and already recognize the first patterns, such as customer density and “white spots”. In order to display an address on the map, the WIGeoWeb software automatically converts it into X/Y coordinates. WIGeoWeb precisely locates addresses worldwide.
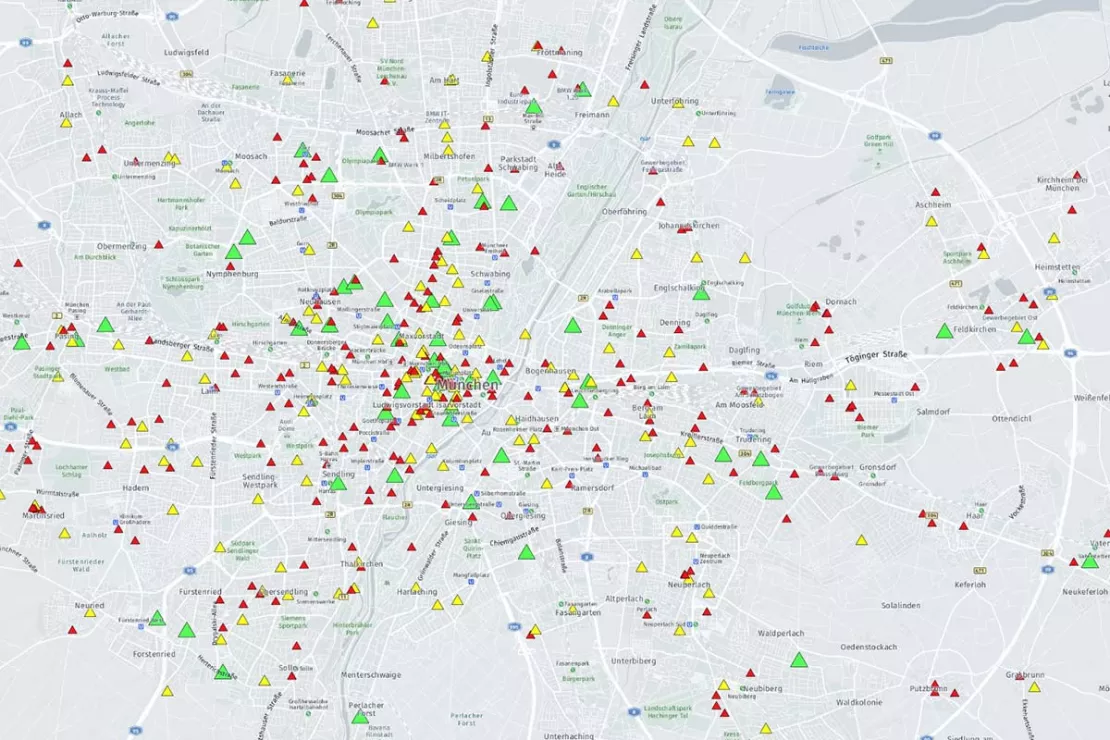
Display Customers by Category
With WIGeoWeb, you can also display your customers by category in colors according to criteria, for example like in the image according to A, B and C customers.
A customers = green
B customers = orange
C customers = red
You can also display your customer data according to criteria such as turnover, sales representative, products, status and much more.
Filter Customers by Criteria
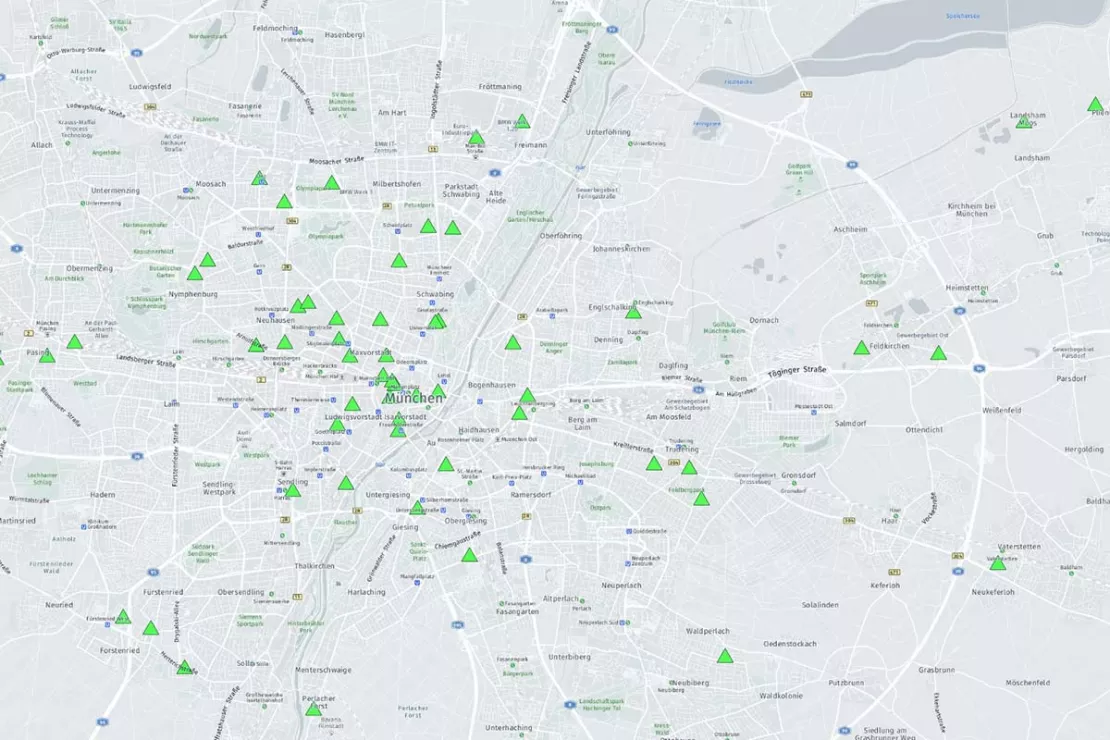
Filters can be set in WIGeoWeb so that you only see certain customers on the map. In the example, the tool only shows A customers.
You can filter your customer data according to any category. For example:
- Turnover higher than
- Customers with product X
- Customers assigned to representative M
- Service contract yes/no
- .......
Your Customers on a Map? Try WIGeoWeb for free with no obligation. The trial period ends automatically.
Edit Customer Data
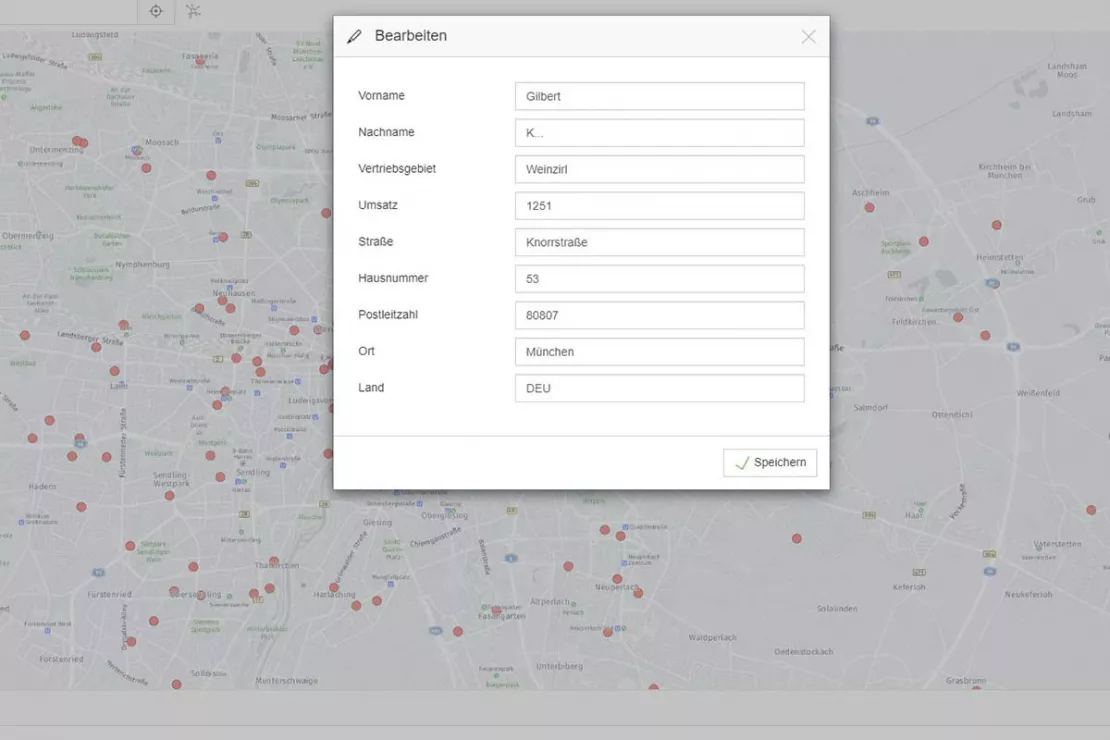
In WIGeoWeb, you can edit individual customer data as well as the data for multiple customers simultaneously. For example, if you assign a new account manager, you can update the data for all the customers in the region. You can of course also create new data.
Select Customers Based on Location
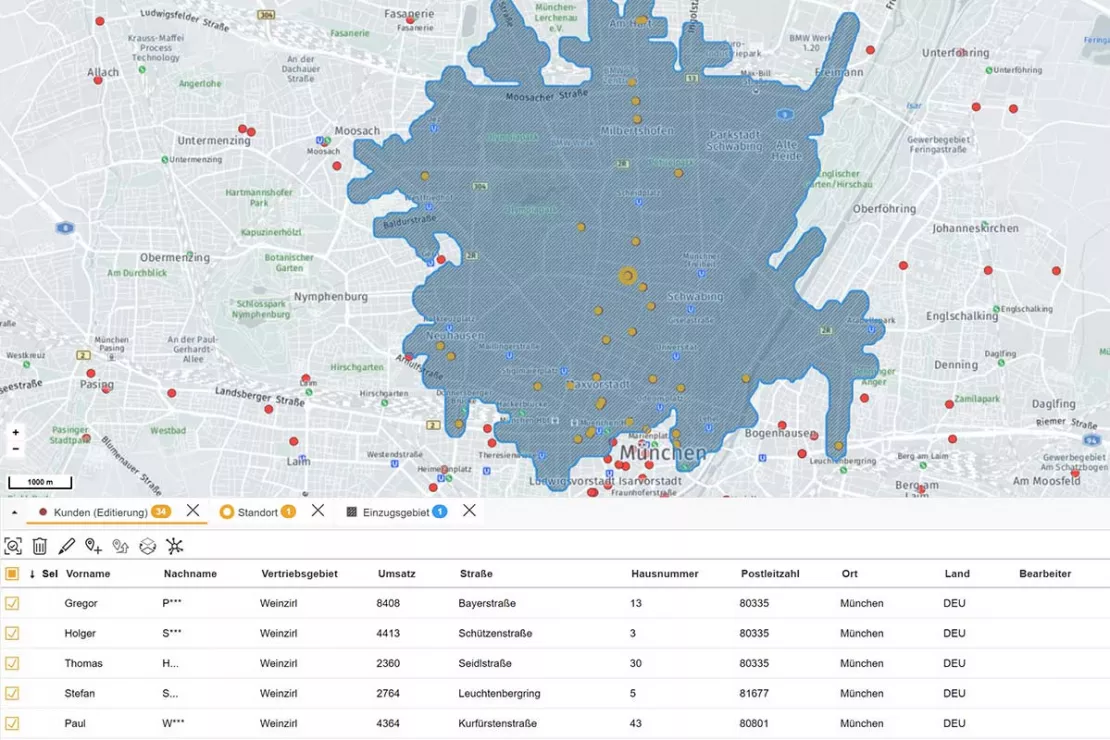
With the WIGeoWeb software, you can select customers according to municipalities, ZIP Codes, service areas, sales areas and other freely defined areas. You can also select all the customers in a single catchment area. The definition is made in terms of time or distance.
Only this limited area is displayed on the map so you can analyze it regionally or on a small scale. Or you can export the selected data.
Print Customers on a Map
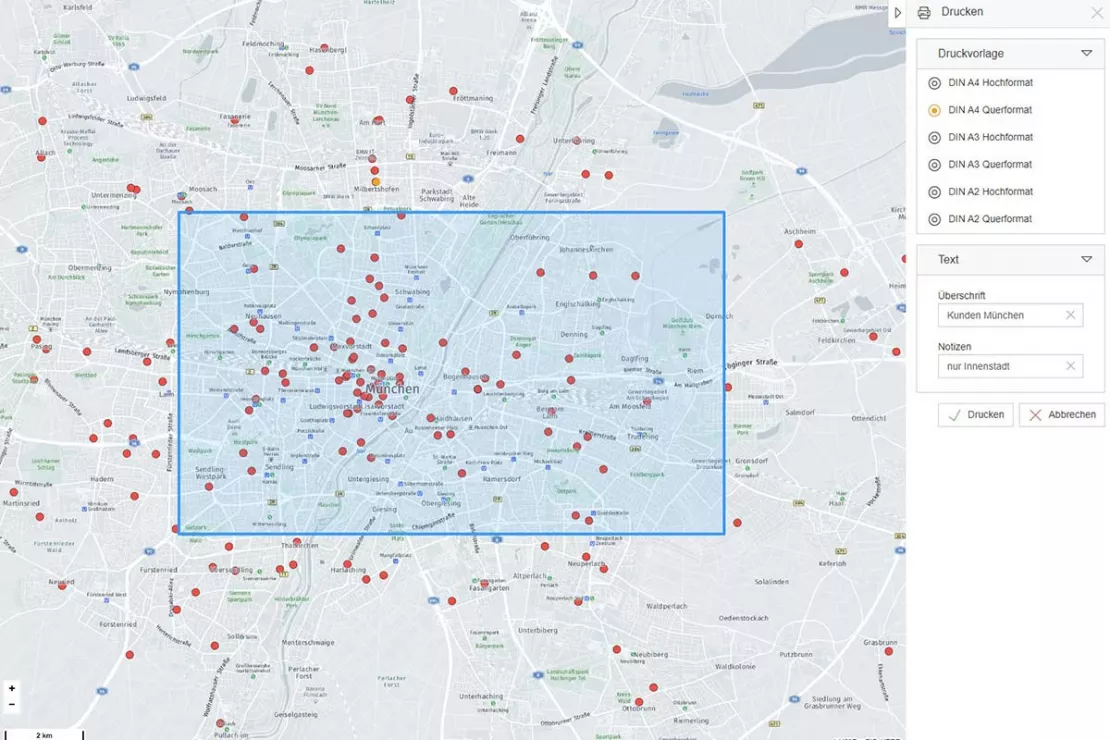
If there is a need, you can even print out the customer maps that you create in WIGeoWeb in different formats ranging from DIN A4 to DIN A2. To do this, draw a window over the area of the map that you want to print.
Send 400 addresses as test data for a free 4-week trial of WIGeoWeb with no obligation!
From Customer Map to in-depth Customer Analysis:
The step from simply displaying your customers on a map to well-founded, professional customer analysis is quick and easy with WIGeoWeb. With the GIS analysis, you gain insights from your customer data that you can use for strategic decisions in sales and marketing.With WIGeoWeb, you not only display your customers on a map, but also answer questions such as:
- Where are my customers with the highest turnover?
- Where are the customers who make frequent purchases or buy the most expensive products?
- Where do the “smart spenders” and “bargain hunters” among my customers live or work?
- Where are the customers who have already purchased product A and might therefore also be interested in product B?
In addition to addresses, other internal data and external demographic data can also be easily integrated and analyzed in WIGeoWeb.
Display customers on a map: Fill out the form, test it free of charge & without obligation!
- Non-binding, free test for 4 weeks
- 400 addresses included
- Test ends automatically without cancellation
- An employee will explain the tool in a short webinar*
* Information about the free test access: Standard regions with selected data in Germany or Austria will be made available. In Germany, these regions are districts in Munich and environs, and districts of Vienna and environs in Austria. The products of WIGeoGIS are intended for companies and are not suitable for private use. If you need a one-time market analysis, we will gladly make you a service offer.
For the test you can send us a maximum of 400 addresses (of customers or locations). We will integrate these into WIGeoWeb for the trial period.
FAQ
-
Who is WIGeoWeb suitable for?
WIGeoWeb is software for spatial analysis. For companies, the representation of customers on maps is often the entry into professional customer analysis and a prerequisite for all further spatial data analyses.
WIGeoWeb is the right tool for you if:
- You want to display locations, customers and addresses on a map
- You want to analyze data with address references in a well-founded and professional manner in the future and want to include geographical data. For example, you want to find out WHERE your target group is, WHERE you generate the most turnover, WHERE which products sell best and WHERE there is still a need for improvement.
- You want to analyze customer data and other data regularly.
- Want to invest a low XY amount.
-
Can I integrate data from different sources into WIGeoWeb?
Yes! Addresses can be integrated into WIGeoWeb from a variety of sources such as:
- Excel spreadsheets
- CRM software
- ERP systems
- All common databases
-
How is customer data imported into WIGeoWeb?
Customer data is imported into WIGeoWeb in the following ways:
- Direct data upload and download
- Interface with automated ETL processes
-
What symbols are used to show the different data points on the map?
Data is usually displayed on the map as pins in different colors. When displaying data in categories, e.g. A, B, C customers, triangles, squares and other shapes can also be used as symbols. The corresponding logos can be integrated into your locations and those of the competition. Points of interest are usually symbolized by icons. We would be happy to discuss other options with you.

